The November Logistics Manager’s Index (LMI) reported a reading of 55.7, continuing a recent slowdown driven by a market correction across inventory and warehousing. The most significant event in the nine-year history of the index was the contraction of Warehousing Utilization (47.5), meaning respondents reported using less available warehousing space month-over-month for the first time ever. This dramatic shift is a clear result of downstream retailers finally drawing down the massive inventory stocks built up throughout 2025. This activity led to modest expansion in overall inventory levels (52.5) and provided relief in the warehousing sector, with capacity loosening (54.8) and the robust expansion of warehousing prices slowing (62.9), though the expansion rate of inventory costs (70.8) remains historically high due to persistent inflationary pressures.
Get the clearest, most accurate view of the truckload marketplace with data from DAT iQ.
Tune into DAT iQ Live, live on YouTube or LinkedIn, 10am ET every Tuesday.
Conversely, the transportation market showed clear upward momentum, suggesting that assets were successfully being engaged to facilitate the holiday flow of goods. Transportation capacity dipped to 50.0 (“No Movement”), the tightest reading since September 2024, signaling constrained supply. Simultaneously, transportation prices jumped to 64.9, reflecting the fastest rate of expansion since February and suggesting that carriers were able to secure higher rates due to the sudden tightness in available capacity. This upward pressure, driven by retail activity, signals a healthy freight market correction out of the previous negative freight inversion. Looking forward, logistics managers expect costs to remain significantly expanded (Future Transportation Prices at 78.4), forecasting leaner inventories and tight, expensive freight capacity for 2026.
National dry van load post volumes increased 5% last week, the final full shipping week of 2025, pushing the load-to-truck ratio up 19% week-over-week to 10.24.
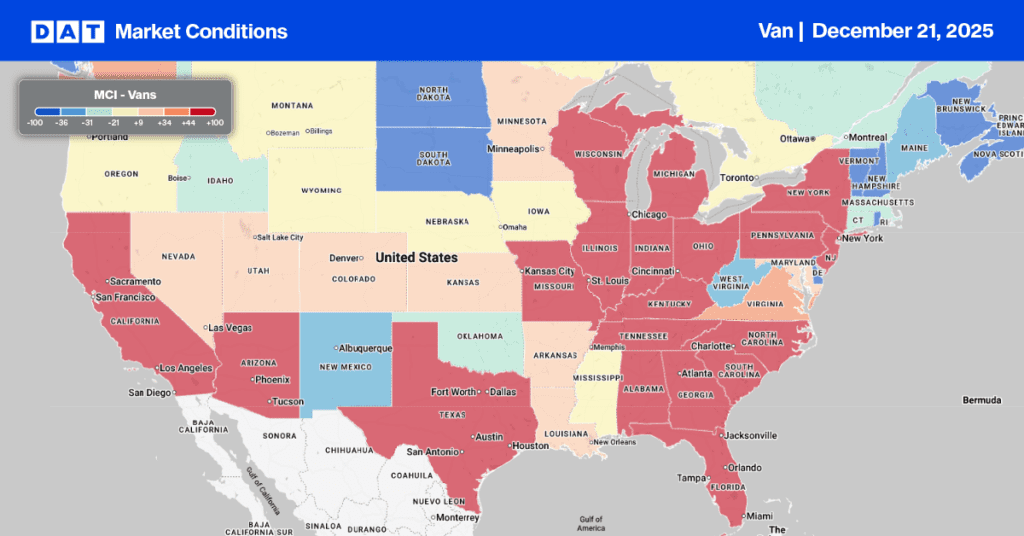
Capacity tightened notably in the Southeast Region, where load post volumes rose 10%. This increase was largely driven by a 21% surge in Miami. Despite the volume spike, Miami remains a deep backhaul market for carriers, and outbound rates saw only a marginal $0.03 increase, reaching $0.83 per mile.
In contrast, inbound Miami spot rates rose $0.05 last week to an average of $2.68 per mile. This rate is $0.18, or 7%, higher than the previous year and represents the highest inbound spot rate observed in three years.

All rates cited below exclude fuel surcharges, and load volume refers to loads moved unless otherwise noted.
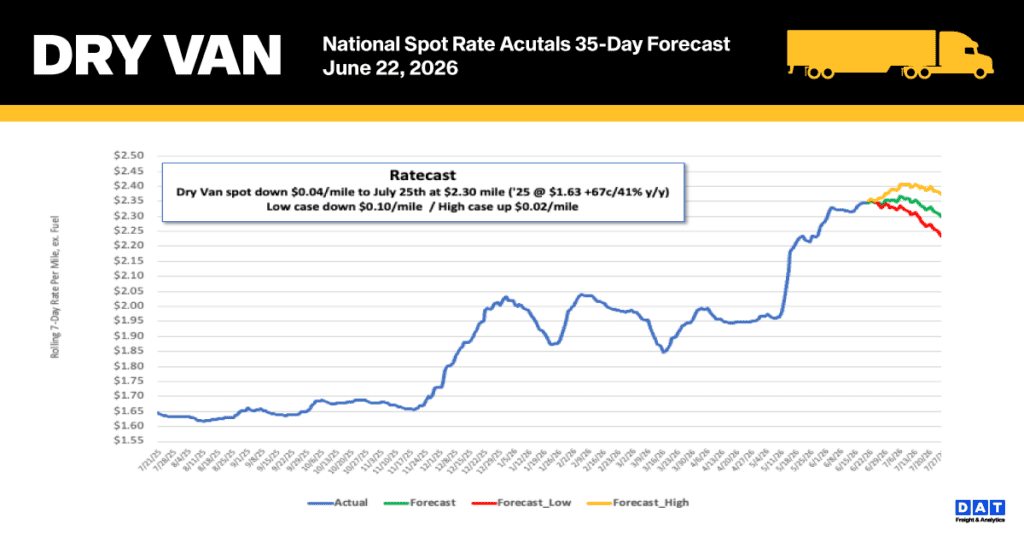
Spot dry van linehaul rates jumped by another $0.07 per mile last week, settling at an average of $1.96 per mile. This rate is $0.19 or 11% higher than the same week last year.
The average rate for DAT’s top 50 lanes by load volume increased by $0.06 per mile last week, averaging $2.26 per mile and $0.31 higher than the national 7-day rolling average spot rate.
In the 13 key Midwest states, which represent 45% of national load volume and often indicate future national trends, spot rates increased by $0.07 per mile to $2.26 per mile, which was $0.30 above the national 7-day rolling average.