November’s trucking ton-mile index showed a promising rebound in freight volumes from a weak October reading. Volumes were up 1.0% year-over-year and roughly neutral with mid-2025 readings. For truckload brokers and shippers, this uptick in demand, when coupled with the steady exit of trucking capacity observed throughout 2025 (and potentially exacerbated by winter weather), suggests a recipe for tighter conditions. Carriers should take note: limited growth in freight volumes towards the end of 2025, while slower than previous boom years like 2014, 2017, and 2018, is occurring in an environment where capacity is constrained.
Get the clearest, most accurate view of the truckload marketplace with data from DAT iQ.
Tune into DAT iQ Live, live on YouTube or LinkedIn, 10am ET every Tuesday.
This ton-mile index has proven its reliability, correlating strongly with the Census Bureau’s official revenue estimates, with a staggering 0.95 correlation on quarter-over-quarter changes. This high level of correspondence validates the index’s utility as an accurate gauge of the market. The implication for 2026 is a market characterized by limited freight growth but, critically, much slower capacity growth. Shippers and brokers should anticipate that even moderate demand increases could quickly put pressure on available trucks, translating to firmer rates. Carriers, while not seeing explosive demand, are poised to benefit from better utilization and pricing power due to the fundamental shift in the supply-demand balance.
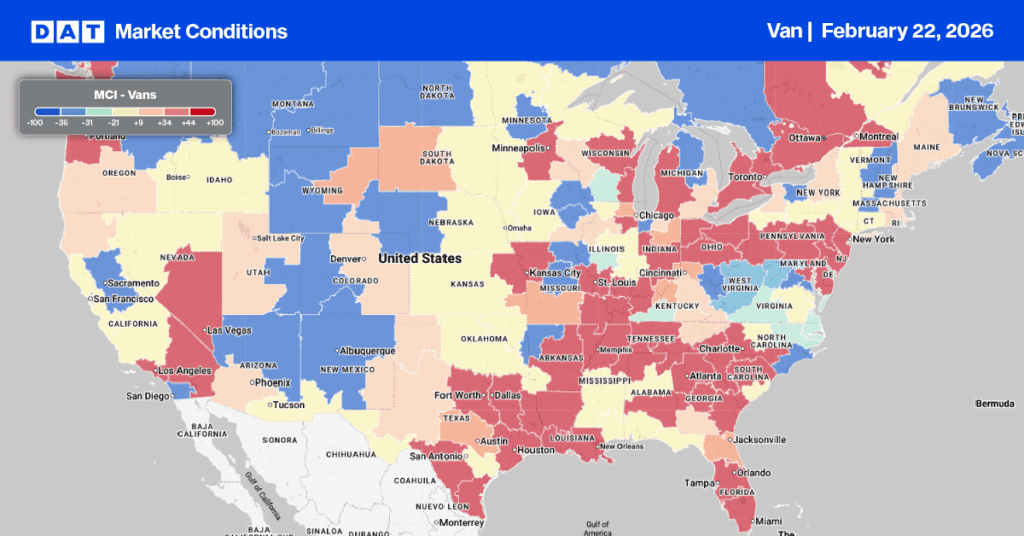
Dry Van Market Conditions Index
Dry van load post volumes saw a third consecutive weekly drop, following an 11% decline last week. However, volumes remain strong, sitting 58% above last year and 110% higher than the 10-year average (excluding the pandemic years of 2021 and 2022). This volume decrease, alongside a 3% reduction in equipment posts, has eased dry van capacity, resulting in the national load-to-truck ratio settling at 8.66.’
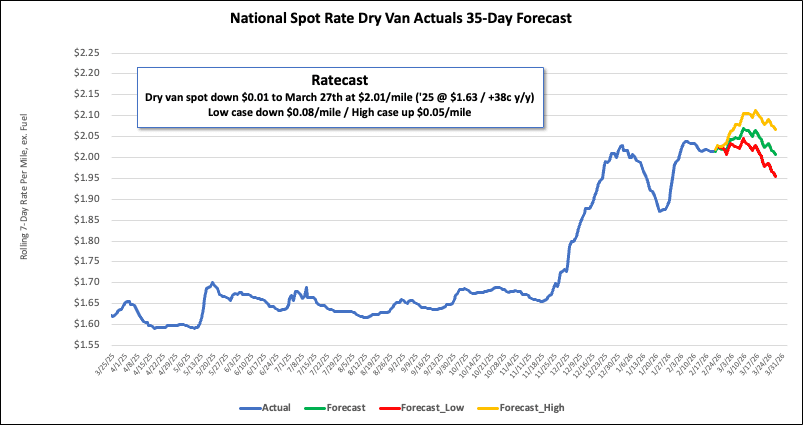
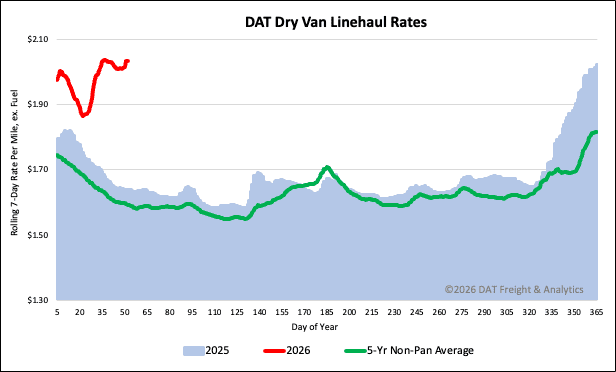
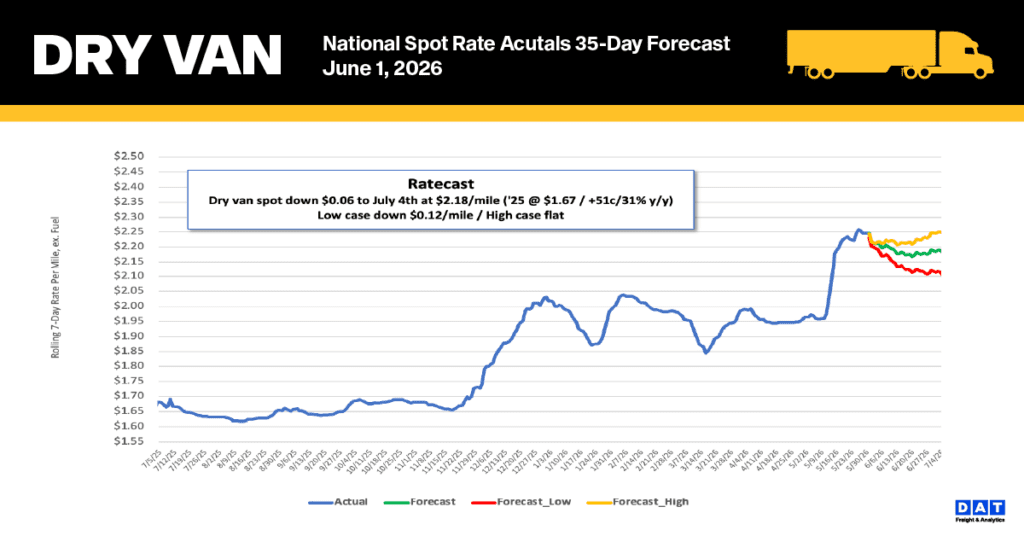
National dry van linehaul spot rates
The national 7-day average dry van linehaul spot rate (excluding fuel) decreased last week by another $0.02 per mile, landing at $2.04 per mile, as available dry van capacity continued to loosen.
Despite this recent drop, the current rate remains high. It is $0.40 (24%) higher year-over-year, and, excluding the pandemic years, it still exceeds the 5-year average by $0.44 (22%).
The average rate for DAT’s top 50 lanes by load volume also decreased by $0.04 per mile last week, averaging $2.26 per mile and $0.22 higher than the national 7-day rolling average spot rate.
In the 13 key Midwest states, which represent around 47% of national load volume and often indicate future national trends, spot rates decreased by $0.08 per mile to $2.48 per mile, which was $0.44 above the national 7-day rolling average.