The factory floor is still humming. The ISM Manufacturing PMI came in at 52.7% in March, a slight uptick from February’s 52.4% and the third consecutive month of expansion. For truckload carriers and brokers, that’s generally good news — manufacturing activity is a leading driver of dry van and flatbed freight demand, and three straight months above 50 signals a sector that’s generating loads.
Get the clearest, most accurate view of the truckload marketplace with data from DAT iQ.
Tune into DAT iQ Live, live on YouTube or LinkedIn, 10am ET every Tuesday.
The March reading is the highest PMI since August 2022, which puts it in a meaningful historical context. We’re not just treading water — this is the strongest factory output signal in nearly four years. New Orders expanded for the third straight month as well, coming in at 53.5%, and Production climbed to 55.1%, up 1.6 points from February.
The catch? The confidence behind those numbers is softening. Demand sentiment flipped to a 1-to-1 ratio of positive-to-negative comments in March, down from a 2-to-1 positive skew in February. Growth is real, but manufacturers are hedging their outlook.
For brokers and carriers, the ISM PMI is a green light with a yellow flag waving. Demand is there. The cost environment is tightening. How those two forces balance through Q2 will go a long way toward determining whether this freight recovery holds.
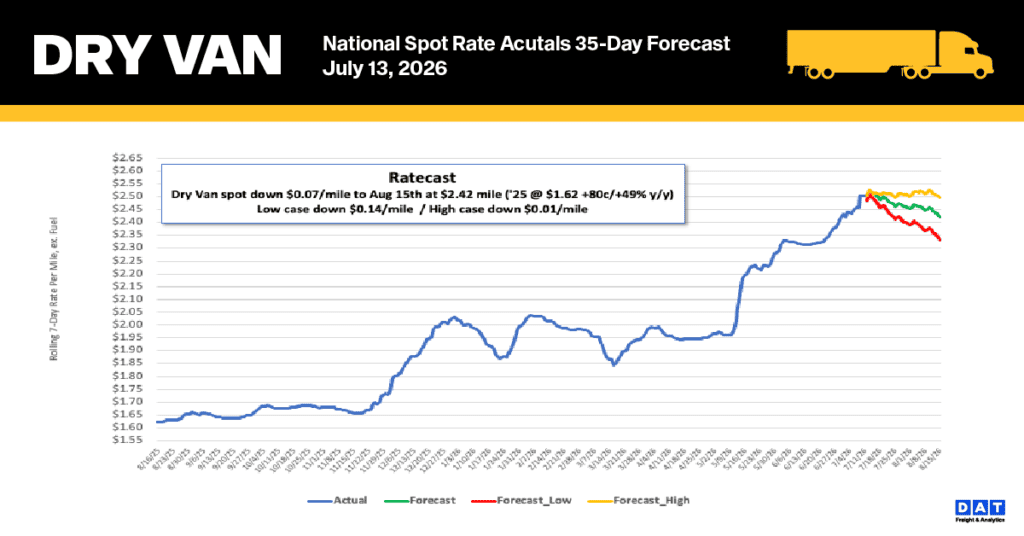
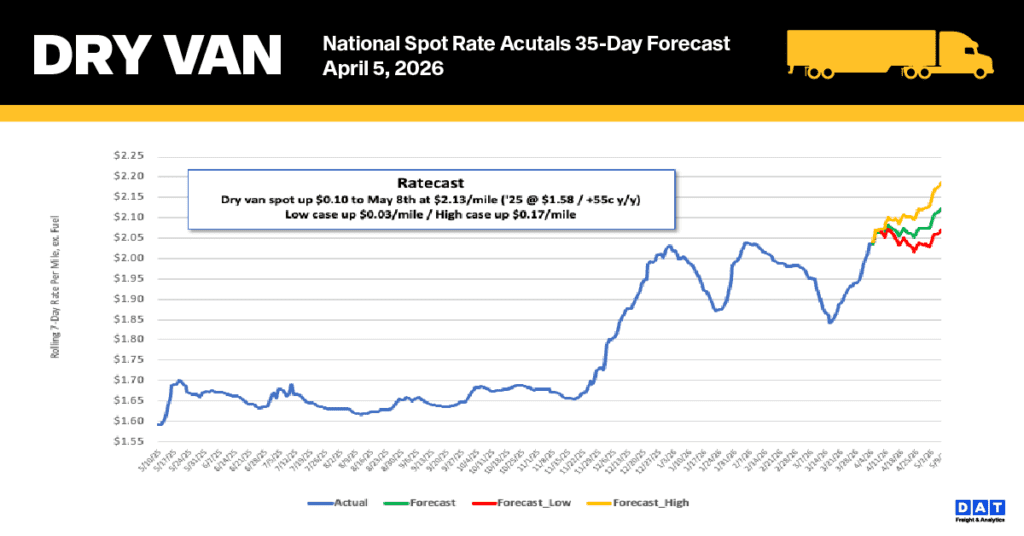
National dry van linehaul spot rates
The national 7-day average dry van linehaul spot rate (excluding fuel) has increased sharply, climbing $0.12 per mile over the last two weeks, with a significant $0.07 jump just last week. With over-the-road diesel prices remaining stable at around $5.85/gallon since the Middle East War began a month ago, spot market carriers are now retaining a larger portion of the fuel surcharge, which is currently at $0.69/mile.
Excluding fuel, the current linehaul rate of $2.04 is significantly higher than previous periods: it is $0.39 (24%) above the rate from one year ago and $0.44 (21%) higher than the five-year average when excluding pandemic-affected years.
Spot rates on DAT’s top 50 lanes by load volume saw an even steeper increase last week, rising by another $0.11 per mile to average $2.40 per mile. This average is $0.40 higher than the national 7-day rolling spot rate.
Similarly, the 13 key Midwest states—which serve as a national bellwether and account for nearly half of the country’s load volume—experienced a strong surge of $0.08 per mile, settling at an average of $2.44 per mile. Consistent with the trend on top lanes, the Midwest average remains $0.40 above the national 7-day rolling average.
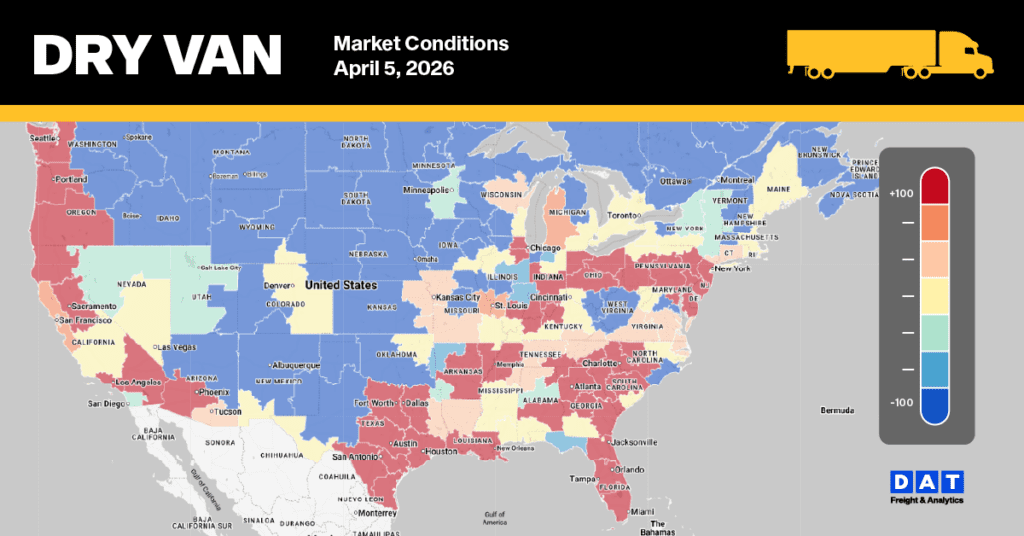
Dry Van Market Conditions
The national dry van load-to-truck ratio fell to 8.96 last week, marking a 12% decrease. This drop was a correction following a month-end surge in the previous week, evidenced by a 14% decline in load posts and a 2% reduction in equipment posts. Despite this recent slowdown, load post volume remains exceptionally high, hitting the highest weekly total in the last decade. This volume is nearly 40% higher than the same week last year and doubles the 10-year average (excluding the pandemic years of 2021 and 2022).