The February 2026 Logistics Managers’ Index (LMI) reported a solid 61.5 reading, up from 59.6 in January and marking one of the more robust expansion readings in recent years. This overall score — comfortably above the 50 threshold that separates contraction from expansion — signals that logistics activity is gathering strength across key sectors. Notably, transportation utilization and transportation prices showed especially strong growth, with transportation prices reaching their highest level since early 2022. Warehousing utilization also expanded, even as warehousing capacity flatlined and inventories remained modest. The data reflect strategic shifts in how firms are managing goods and cashflow: many are keeping lean inventories to avoid tariff-related costs, while moving existing inventory more quickly through the system. Transportation capacity is contracting even as utilization rises, suggesting carriers are running tighter networks and that asset scarcity could keep pricing elevated. These dynamics point to a logistics landscape where demand for freight movement is strengthening faster than the supply of capacity.
Get the clearest, most accurate view of the truckload marketplace with data from DAT iQ.
Tune into DAT iQ Live, live on YouTube or LinkedIn, 10am ET every Tuesday.
For the 2026 freight market outlook, the LMI’s forward‐looking predictions are cautiously optimistic. Respondents foresee continued expansion in the overall index and believe that transportation and warehousing prices will remain elevated, driven by ongoing tight capacity and high utilization. Such conditions typically bolster freight rates, benefiting carriers capable of matching demand with assets. However, the contraction in transportation capacity and the variability in inventory approaches between larger and smaller firms introduce some uncertainty into the forecast. If capacity continues to tighten without proportional increases in asset availability, shippers may face upward pressure on freight costs and volatility in service. In this context, carriers and logistics managers should prepare for a year where rate discipline, asset management, and strategic network optimization will be critical levers — not just to capture demand, but to navigate the cost and capacity imbalances shaping the freight market in 2026.
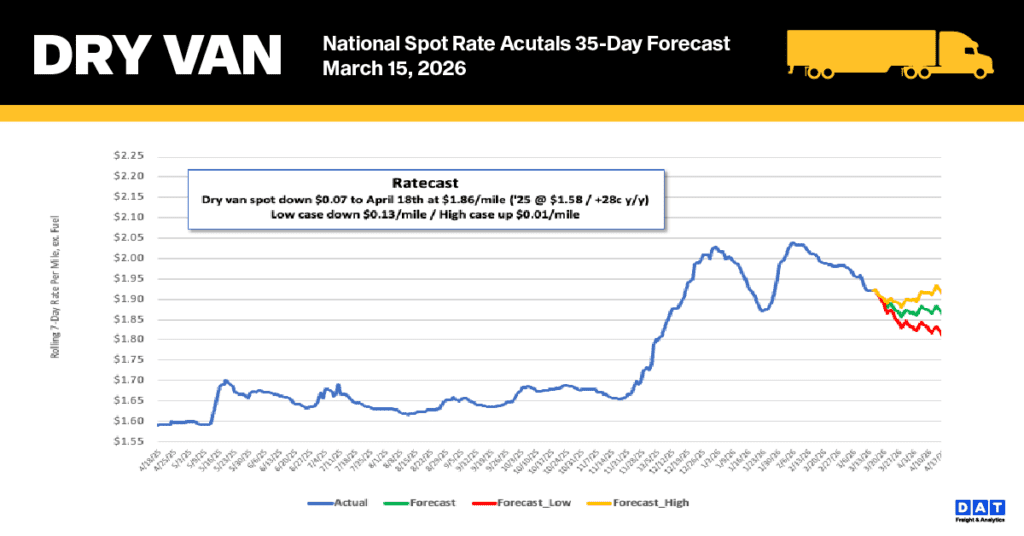
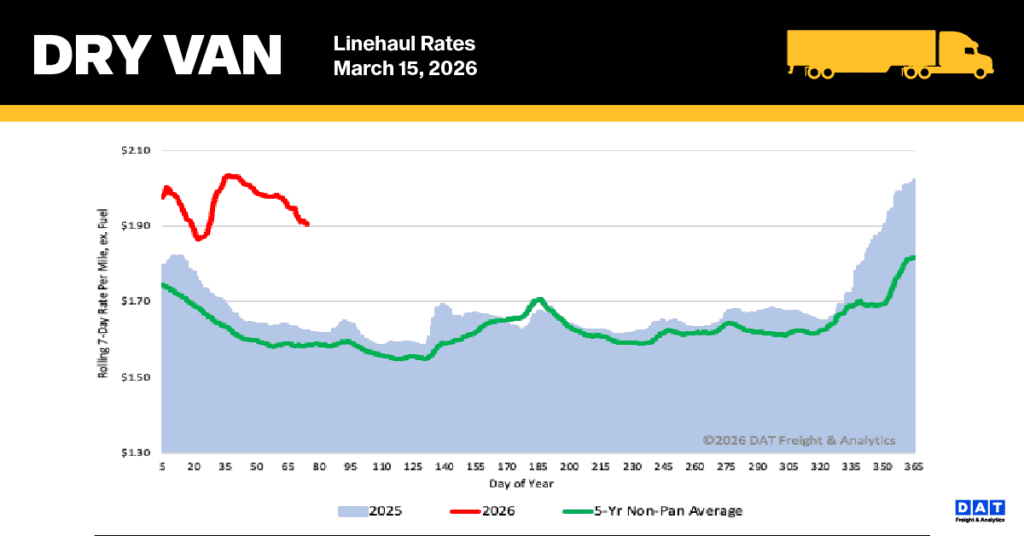
National dry van linehaul spot rates
Despite the almost $1.00 per gallon jump in over-the-road diesel since the Middle East War began two weeks ago, the national 7-day average linehaul spot rate (excluding fuel) for dry van trucks actually fell by $0.08 per mile last week to $1.92 per mile. While rising fuel surcharges—up 36% from $0.44/mile to $0.60/mile in two weeks—are causing all-in spot rates to slowly increase, carriers are struggling to negotiate rate increases on a load-by-load basis that fully cover their higher costs at the pump. Consequently, the increase in all-in spot rates is lagging far behind the rapid escalation of fuel prices.
Even with this recent decline, the rate is still elevated. It is currently $0.28 (18%) above the rate recorded a year ago and, when excluding the pandemic-affected years, it remains $0.32 (17%) higher than the five-year average.
The average rate for DAT’s top 50 lanes by load volume decreased by $0.06 per mile last week, averaging $2.18 per mile and $0.28 higher than the national 7-day rolling average spot rate.
In the 13 key Midwest states, which represent almost half of national load volume and often indicate future national trends, spot rates decreased by $0.13 per mile to $2.31 per mile, which was $0.41 above the national 7-day rolling average.
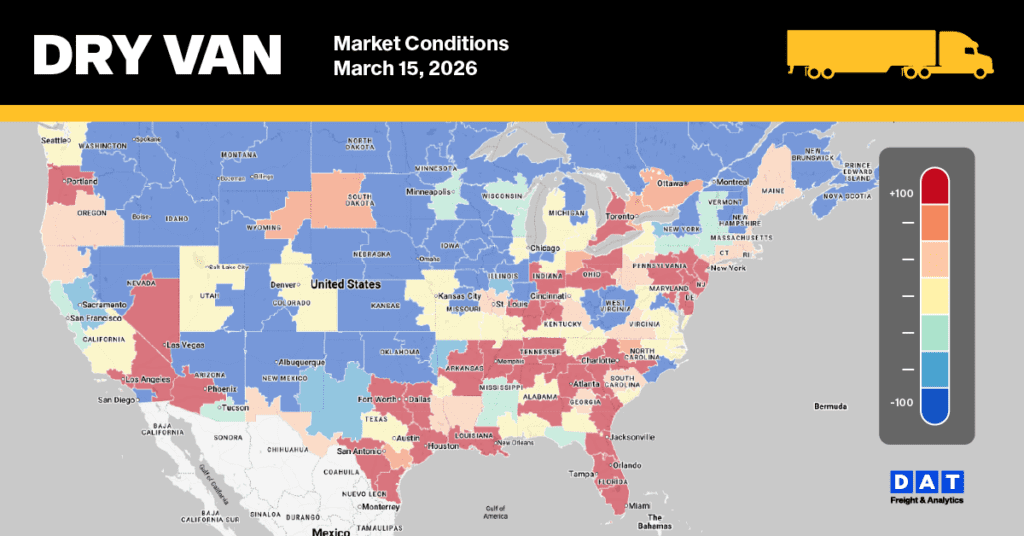
Dry Van Market Conditions
Despite falling for the third consecutive week, dry van load post volumes remain robust, staying 48% higher than the same time last year and almost double the 10-year average (when excluding the pandemic-affected years of 2021 and 2022). This higher volume, combined with a 9% drop in equipment posts, led to a 5% increase in the national load-to-truck ratio last week, which reached 8.12.