Data Analysis for the Week Ending Saturday, May 9th, 2026. All rates cited below exclude fuel surcharges, and load volume refers to loads moved unless otherwise noted. The rate charts exclude 2021 and 2022 years influenced by the pandemic.
How an $116,000 swing in annual gross profit tells the story of the freight cycle — and why 2026 feels like 2022 in reverse.
The story of owner-operator and small fleet profitability over the past eight years comes down to two variables: spot rates and diesel. When they move together, carriers survive. When they diverge, trucks go dark. DAT Freight & Analytics data tracking estimated annual gross profit for small fleet owner-operators reveals a swing from positive $46,550 (June 2018) to negative $5,700 (May 2020) to positive $110,200 (January 2022) and back down to $5,700 (October 2025) — and now recovering to $36,000 (April 2026) — a full cycle that took eight years to complete and wiped out thousands of small carriers along the way.
Meanwhile, those carriers that have remained operational are positioned to capitalize on their steadfast commitment to maintaining rate discipline and managing expenses.
But to understand that cycle fully, you have to start where the data does: the 2018 ELD boom that first proved regulatory shocks move rates.
Get the clearest, most accurate view of the truckload marketplace with data from DAT iQ.
Tune into DAT iQ Live, live on YouTube or LinkedIn, 10am ET every Tuesday.
The pre-ELD baseline (early 2018): Strong footing before the spike
Even before the ELD mandate fully took hold, January 2018 opened with all-in spot rates at $2.24/mile and annual gross profit of $43,700. Breakeven costs were a manageable $1.63/mile, leaving a $0.33/mile gross margin. Small fleet operators were running profitably, but the real catalyst was still building.
The ELD shock (April–June 2018): Regulation as a capacity event
ELD mandates took full effect in April 2018, compressing available capacity overnight. All-in spot rates surged to $2.32/mile in June — the highest reading in the dataset before the pandemic era. Small fleet annual gross profit peaked at $46,550 with linehaul rates hitting $2.03/mile against a $1.66/mile breakeven. It was the best margin environment of the pre-pandemic decade — and carriers responded accordingly.
Several forces compounded the euphoria. A booming industrial economy and in May 2018, the first round of Trump tariffs on Chinese goods triggered a wave of shippers front-loading imports ahead of further escalation — a demand pull-forward that kept freight volumes artificially elevated through the summer. Then, in September, carriers placed record numbers of new truck orders, betting the good times would last. They were wrong. As tariff front-loading unwound and demand normalized, the market cooled rapidly into Q4 2018. Those new trucks — ordered at the peak — began rolling off assembly lines and into a softening market. By 2019, the industry was sitting on a structural oversupply of capacity that no amount of rate discipline could quickly absorb. The ELD boom had seeded its own bust.
The 2019 freight recession: Seven months from peak to pain
The hangover was severe. Over the six months from June 2018’s peak to January 2019, spot linehaul collapsed from $2.03 to $1.67/mile as shippers who had front-loaded inventory ahead of the ELD deadline let demand normalize. Annual gross profit fell from $46,550 to $19,950 in six months, then dropped further to $3,800 by April 2019. A brief June recovery to $13,300 proved illusory — by July rates retreated and gross profit spent the next five months grinding between $6,650 and $9,500. Breakeven costs held steady at $1.62–$1.65/mile — costs weren’t the problem. Rates simply wouldn’t cooperate. This was the market’s first modern demonstration of how quickly a capacity shock reversal can gut small fleet margins.
The false dawn (late 2019–early 2020): A glimpse, then the floor drops
December 2019 flashed hope — rates briefly recovered to $1.94/mile all-in and gross profit jumped to $18,050. Then COVID hit. April and May 2020 produced the only negative gross profit months in the dataset: –$4,750 and –$5,700 respectively, as all-in rates collapsed to $1.62 and $1.59/mile while breakeven costs barely budged at $1.58–$1.59/mile. It was a brief but brutal reminder that breakeven isn’t the floor — it’s just where you stop making money and start burning it.
The pandemic boom (2020–2022): $1.00/mile margins and a diesel ambush
Pandemic stimulus, inventory restocking, and port congestion drove spot rates from $1.59/mile in May 2020 to $3.11 by January 2022. Small fleet gross profit surged to $110,200 — the highest in the dataset. Operating costs rose modestly, but rates rose faster. Owner-operators were earning over $1.00/mile in gross margin. Then Russia invaded Ukraine. Diesel spiked, pushing breakeven costs from $1.77 to $2.08/mile in five months — a 17% jump. Rates were already falling. By October 2022, gross profit had collapsed 75% to $27,550.
The grind (2023–2025): Two years at near-breakeven
Spot linehaul rates bottomed around $1.54–$1.65/mile and flatlined for nearly two years. Gross profit hovered between $3,800 and $19,950 for 24 consecutive months, with most months in the $6,000–$12,000 range. At those levels, an owner-operator barely covers a truck payment. This is the period that drove the capacity rationalization — small fleets exiting, authorities being revoked, and the industry slowly bleeding out excess trucks. It was the longest freight recession in a generation, and the carriers who survived it earned what’s coming next.
Late 2025–2026: The turn — and a new diesel shock
Spot rates began climbing in December 2025, with gross profit jumping to $29,450 as all-in rates hit $2.29/mile. January and February 2026 continued the trend — $30,400 and $32,300 respectively — as the market responded to tighter capacity from two years of carrier attrition and expanding ISM manufacturing activity. Then the Iran war hit. Diesel surged close to $6.00/gallon, pushing owner-operator breakeven costs from $1.88/mile in February to $2.09/mile by early May — a spike eerily similar in magnitude to the 2022 Ukraine shock. The difference: this time, spot rates are rising too. May’s all-in rate of $2.62/mile is the highest since mid-2022, producing a gross profit of $25,000 despite the elevated costs. The rate recovery and the diesel spike are running a race, and right now, rates are keeping pace.
The bottom line
The 2018–2026 arc tells one story on repeat: regulatory shocks, demand surges, and geopolitical events can all spike rates — but the carriers who profit from those spikes are always the ones who survived the preceding bust. The 2019 freight recession filtered out the weakest operators before the pandemic windfall arrived. The 2023–2025 grind did the same before the current recovery. Small fleet operators who made it through either cycle didn’t just get lucky. They controlled costs, built partnerships, reduced deadheading, and managed fuel exposure when margins were measured in hundreds of dollars per month, not tens of thousands.
Now the cycle is turning again, and the 2022 playbook remains the warning: diesel spikes can erase margin gains in months even when rates are elevated. The gap between $25,000 in annual profit and breakeven is thinner than the headline numbers suggest. Fuel cards, slowing down, surcharge audits, and deadhead reduction aren’t optional for the next phase of this recovery. They’re what separates the carriers who ride it from the ones who get crushed by it — again.
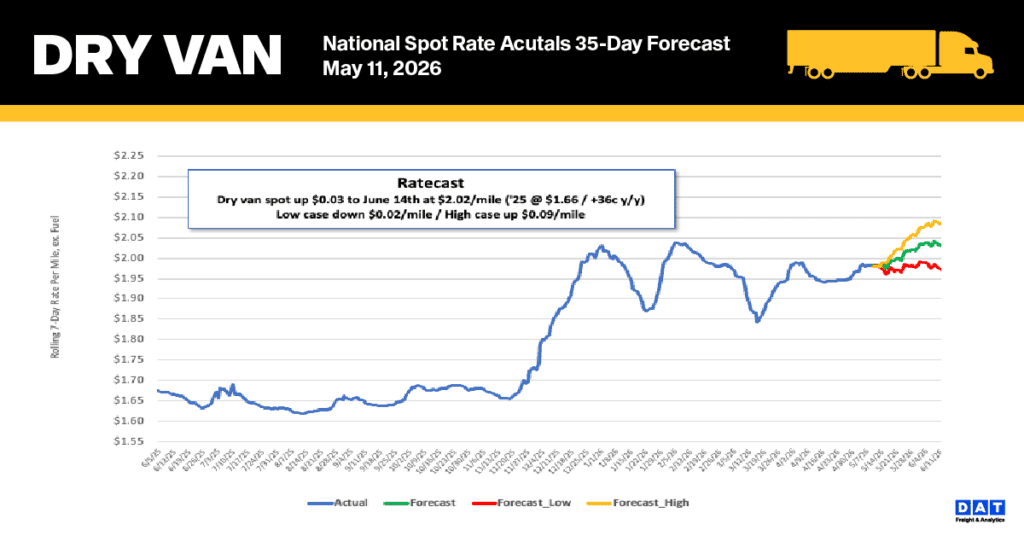
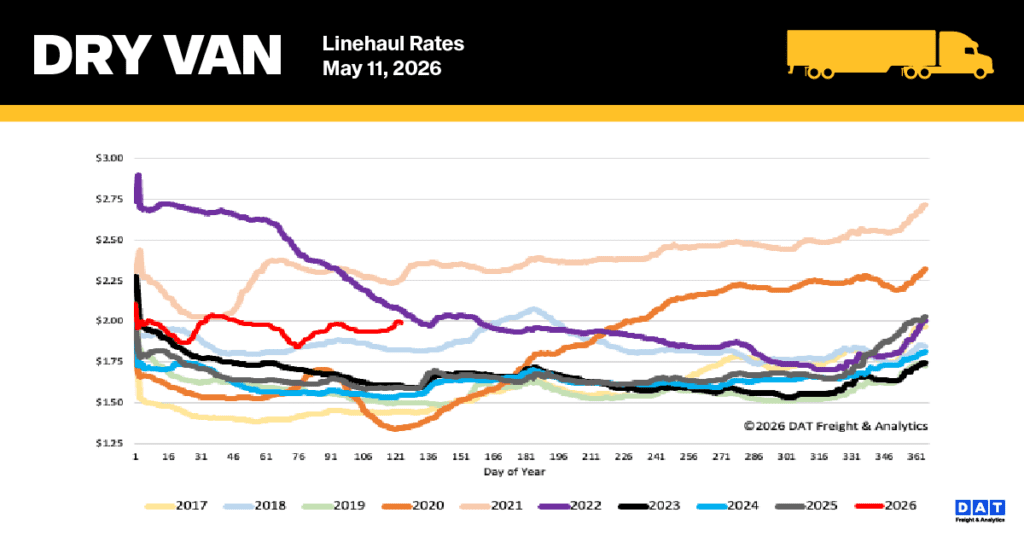
National dry van linehaul spot rates
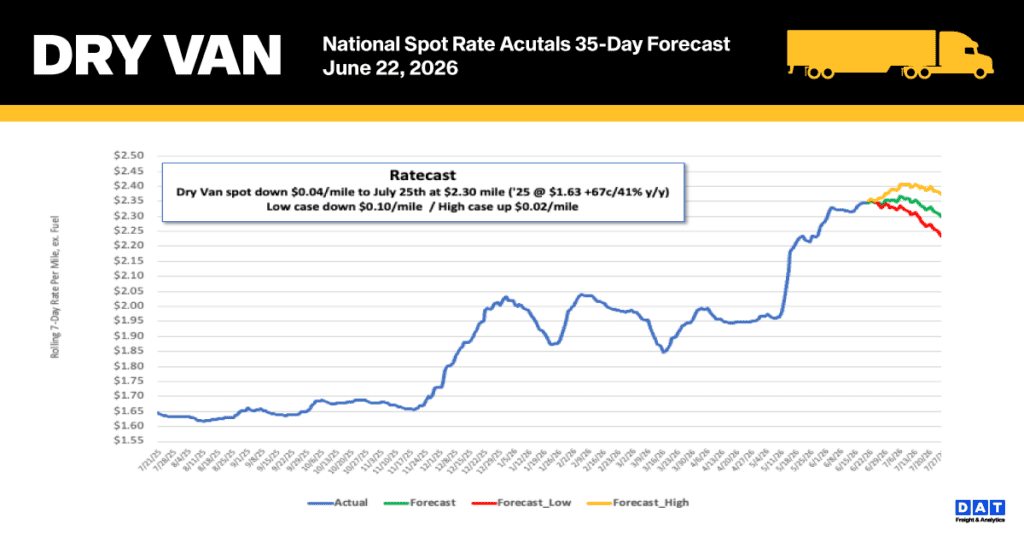
Over the past week, the national 7-day average linehaul spot rate for dry vans (excluding fuel) rose by an additional cent, reaching $2.01 per mile. This rate substantially exceeds historical levels, coming in $0.41 (26%) higher than the same period last year. When pandemic-influenced years are removed from the data, the current rate sits $0.47 (24%) above the five-year average.
Last week, spot rates on DAT’s top 50 lanes, based on load volume, remained flat last week, settling the average at $2.36 per mile. This figure is $0.35 higher than the national 7-day rolling spot rate.
The 13-state Midwest region, which accounts for nearly half of the country’s load volume and serves as a critical economic barometer, saw average linehaul rates hold steady at $2.29 per mile. By maintaining a $0.29 premium over the national 7-day rolling average, the Midwest continues to demonstrate its role as a strong performer, with this consistency evident across its major shipping corridors.
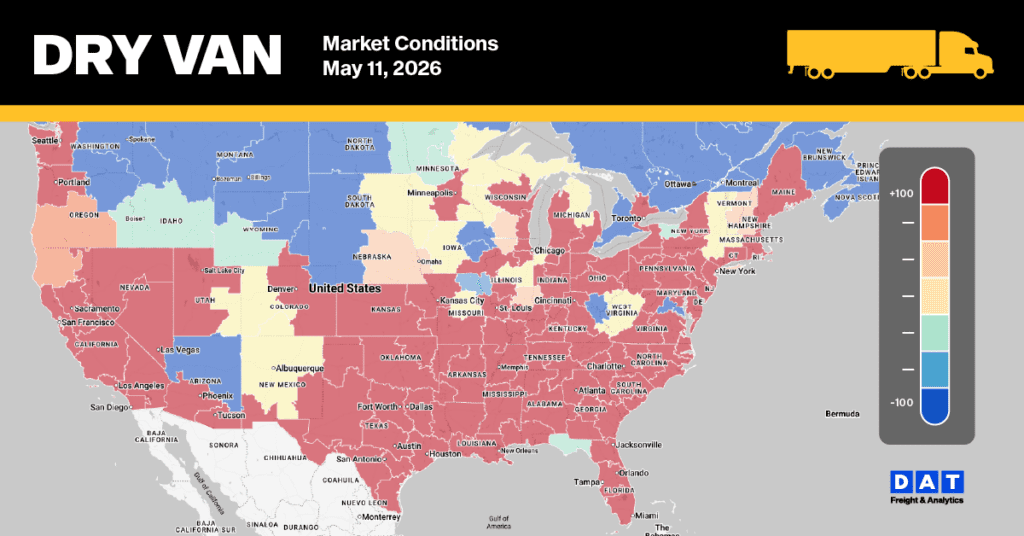
Dry Van Market Conditions
The national dry van load-to-truck ratio climbed 8% to reach 8.95, bolstered by a 3% week-over-week growth in load post volumes. Meanwhile, the market saw its lowest equipment post count of the year following a 5% weekly decline, a figure that now sits 22% lower than the same period last year as regulatory and enforcement actions continue to constrain capacity. Excluding pandemic-influenced data from 2012 and 2022, current equipment availability has dropped 44% below the long-term average established since 2017.