Data Analysis for the Week Ending Saturday, May 9th, 2026. All rates cited below exclude fuel surcharges, and load volume refers to loads moved unless otherwise noted. The rate charts exclude 2021 and 2022 years influenced by the pandemic.
Single-family housing starts surged 9.7% in March, topping 1 million units for the first time in over a year and posting an 8.9% gain year-over-year — a welcome headline for flatbed carriers who move the lumber, steel, drywall, and roofing materials that feed active job sites. The West led the regional recovery with an 18% monthly jump in new single-family units, followed by the Northeast at 11% and the South at 8.5%. For flatbed operators working building materials corridors out of the Pacific Northwest, Interior West, and Southeast, more active starts translate to more boards, beams, and trusses moving to job sites — and that’s showing up in spot rate tension on lanes tied to construction-heavy markets.
The more cautious read for flatbed demand, however, is in the permits data. New housing permits dropped 10.8% month-over-month in March and fell 7.4% from a year ago, landing at 1.37 million — well below February’s 1.54 million pace. Permits are the forward indicator that matters most for freight: they signal what will be under construction 60 to 90 days from now. The West and Northwest, typically among the strongest flatbed demand generators, posted the steepest permit declines. Large multifamily projects of five or more units cratered 23%, further compressing the pipeline for structural steel and precast concrete hauls. With 62% of builders telling NAHB that suppliers are raising costs due to fuel concerns tied to the Iran conflict, and 70% struggling to price homes, the enthusiasm driving March starts may not translate into a sustained pipeline of new work.
For flatbed carriers and brokers, the March data tells two stories at once. The starts bounce is real and is already generating near-term freight demand — but it reflects a pipeline built before the Iran conflict disrupted builder confidence, fuel costs, and interest rate expectations. The permit pullback is the leading edge of a potential air pocket in flatbed demand heading into Q3, when today’s permitted projects would otherwise be breaking ground.
Get the clearest, most accurate view of the truckload marketplace with data from DAT iQ.
Tune into DAT iQ Live, live on YouTube or LinkedIn, 10am ET every Tuesday.
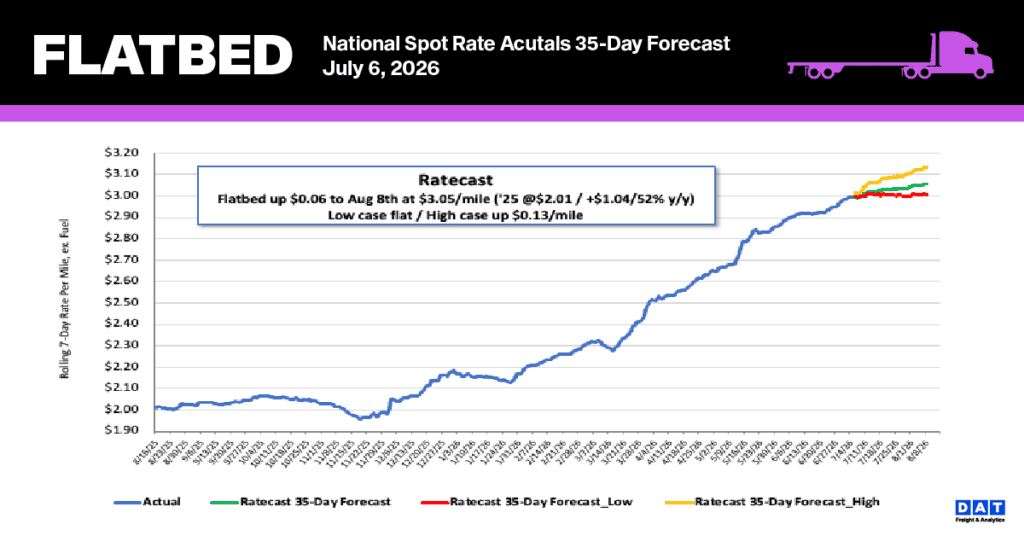
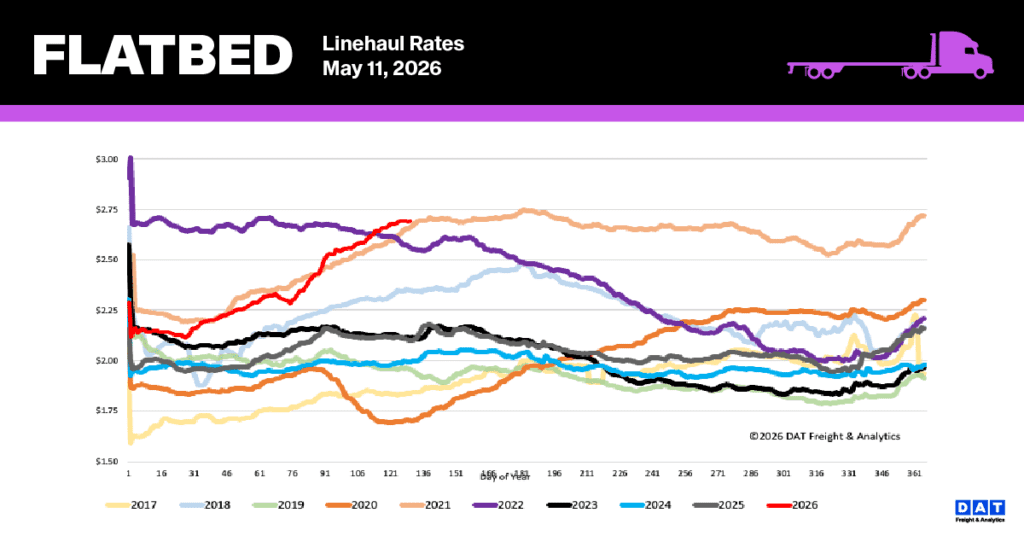
National flatbed linehaul spot rates
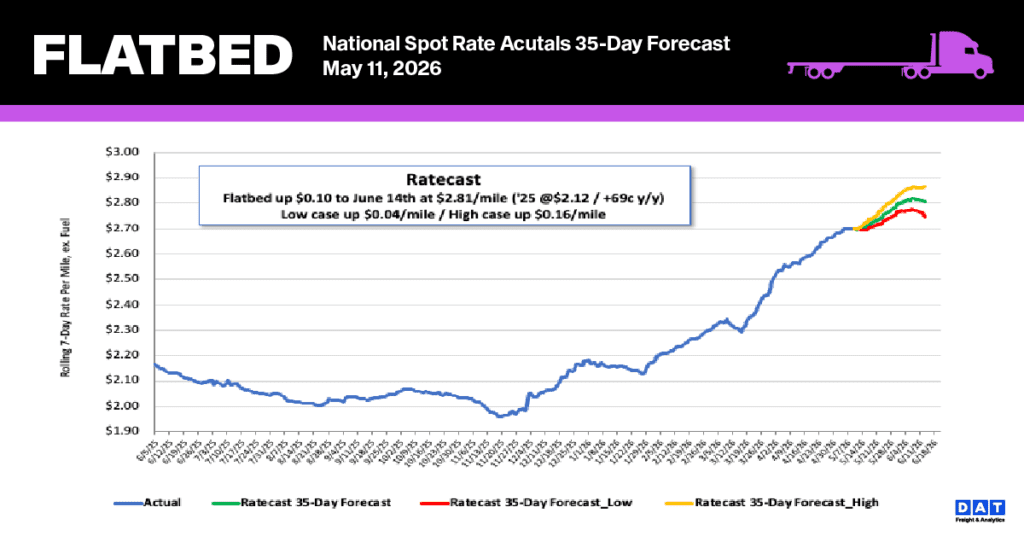
Flatbed rates have entered a plateau phase, rising by only a cent to an average of $2.70 per mile after a seven-week stretch of $0.05 weekly gains. Despite this slowdown, the segment has grown by $0.39 per mile (15%) over the past two months, marking the highest Week 19 rates ever recorded. Current pricing sits within $0.05 of the record set in early July 2021. Compared to historical benchmarks, the current rate remains significantly higher, outperforming the same period last year by $0.59 (28%) and exceeding the five-year average (excluding pandemic-era data) by $0.72 (27%).
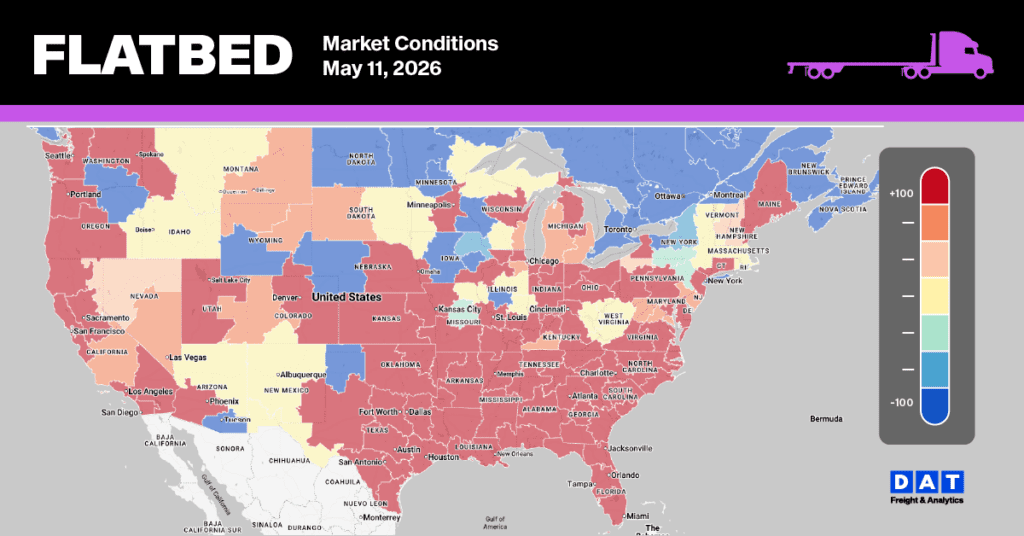
Flatbed Market Conditions
The flatbed market appears to be transitioning into a seasonal plateau. While load post volumes cooled by just over 1% last week and 18% over the past month, they remain robust compared to historical norms, sitting 56% higher than last year and 42% above the five-year average (excluding 2021 and 2022). Capacity remains constrained as equipment posts declined 3% to their third-lowest level this year. These shifting supply and demand dynamics resulted in the flatbed load-to-truck ratio rising 2% to reach 64.35.