All rates cited below exclude fuel surcharges, and load volume refers to loads moved unless otherwise noted. The rate charts exclude 2021 and 2022 years influenced by the pandemic. Analysis for the week ending Saturday, May 23rd, 2026, week 21.
The April Cass report is a cautionary tale for shippers: demand hasn’t recovered, but the cost of moving freight isn’t holding out for it.
Shipments fell 4.4% year over year in April — the third consecutive monthly sequential gain, but still firmly in negative y/y territory.  Meanwhile, the cost side is already repricing. The Cass Truckload Linehaul Index jumped 3.2% month over month to a 5.6% year-over-year increase — the largest annual gain since August 2022 — while total freight expenditures rose 3.5% year over year. 
Get the clearest, most accurate view of the truckload marketplace with data from DAT iQ.
Tune into DAT iQ Live, live on YouTube or LinkedIn, 10am ET every Tuesday.
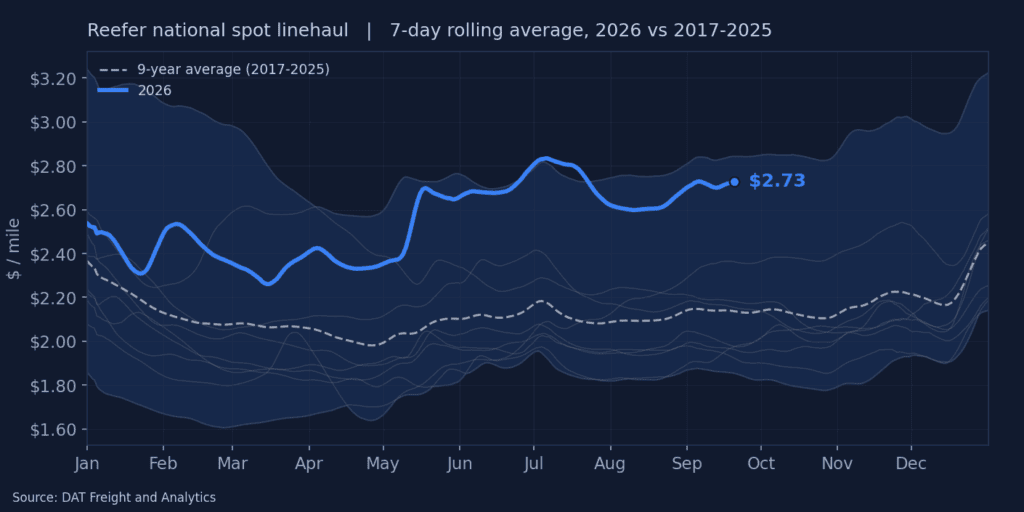
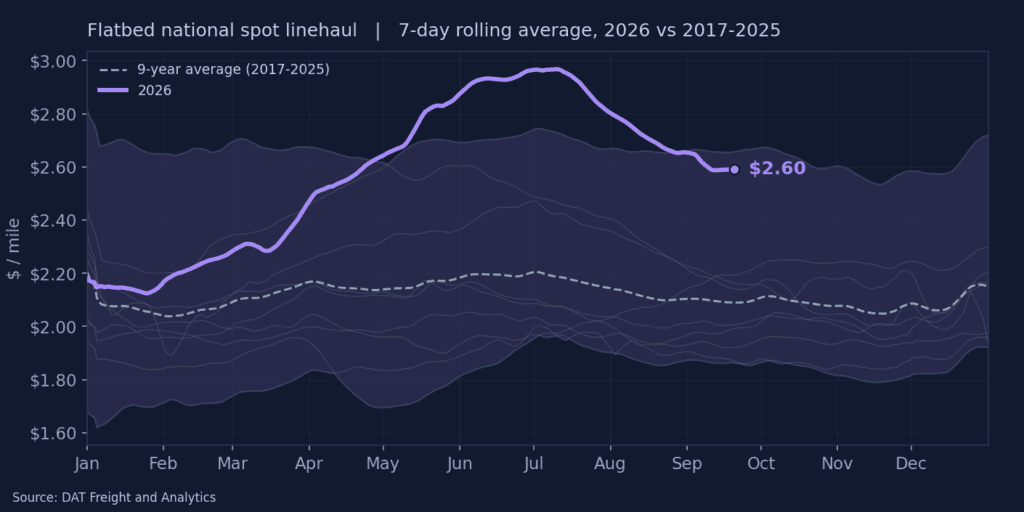
This is a supply story masquerading as a demand recovery. An incipient driver shortage, accelerated by new FMCSA regulations, is the primary catalyst — and capacity tightness that started in dry van is now radiating into reefer and flatbed, with LTL and intermodal likely to follow.  DAT spot rates corroborate the signal, running roughly 25% above year-ago levels in April.
Shippers waiting for volume to fully recover before revisiting rate assumptions may find the market has already moved past them.
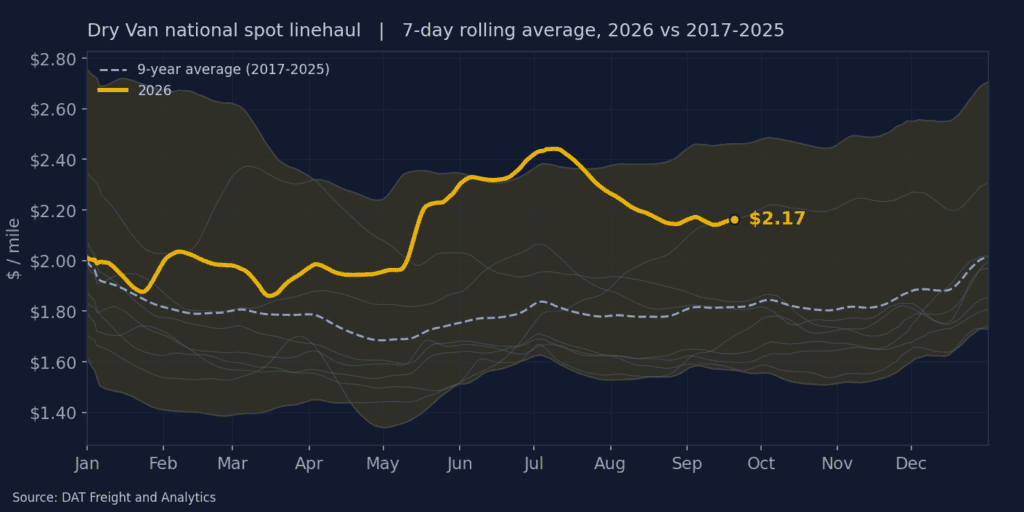
National dry van spot rate trends
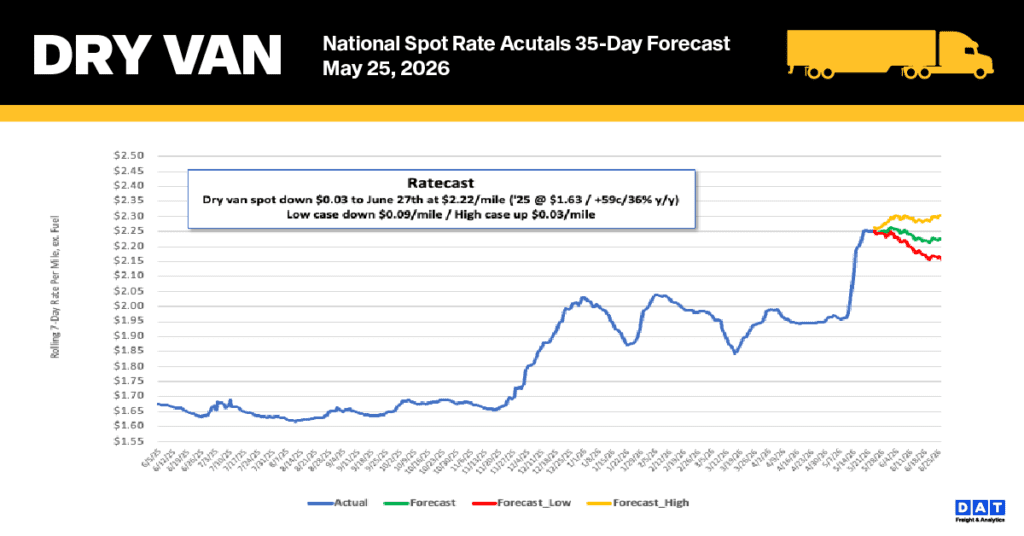
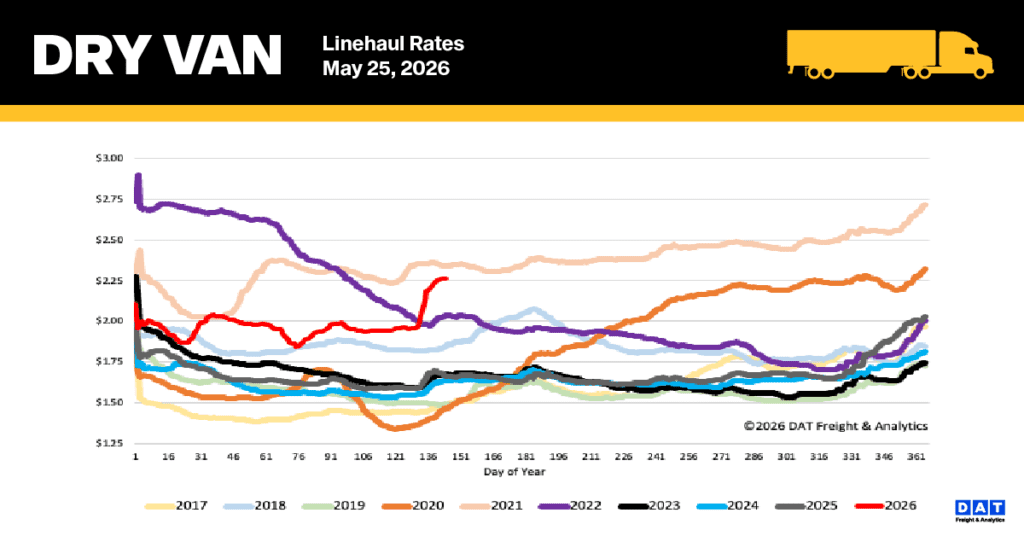
National dry van spot rates maintained their upward trajectory as market capacity recovered gradually from the Roadcheck Week contraction. Last week, linehaul rates (excluding fuel) rose by $0.05 per mile, bringing the 7-day national average to $2.27 per mile—a figure that notably exceeds historical norms. This rate represents a 36% ($0.60) increase over the same period last year and remains 30% ($0.68) higher than the non-pandemic five-year average.
Performance across key segments included:
- Midwest Region: As a critical economic bellwether handling nearly 50% of national load volume, this 13-state area saw rates climb by $0.20 per mile to an average of $2.64, sustaining its pattern of strong performance in major corridors.
- High-Volume Lanes: The average for DAT’s top 50 lanes increased by $0.17 per mile to reach $2.68, which is $0.41 above the overall national 7-day average.
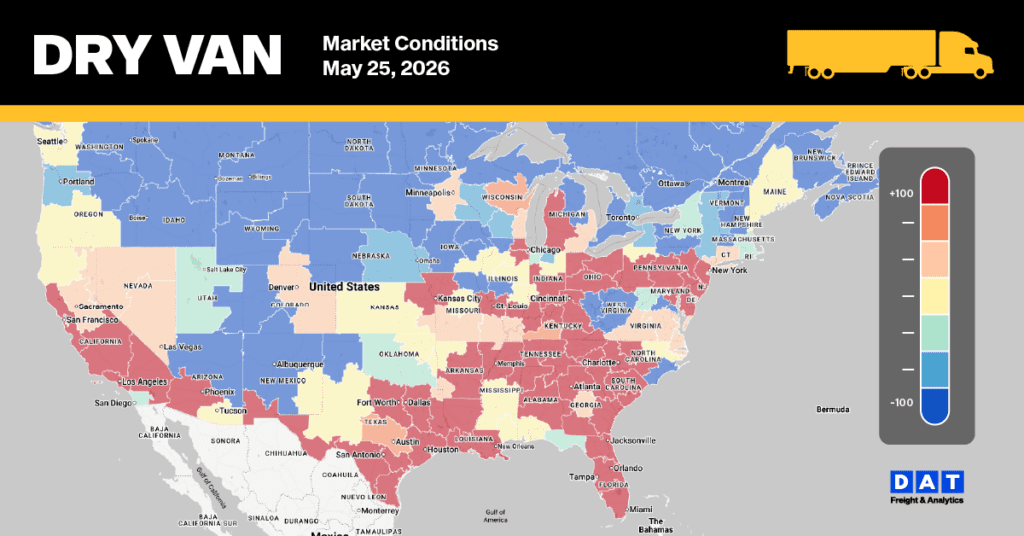
Dry Van Market Conditions
Last week, the national dry van load-to-truck ratio fell 6% to 12.04 as capacity gradually re-entered the market. Even with a 6% dip in load posts, volumes remain 30% above pre-Roadcheck levels and 57% higher than last year, highlighting the sustained tightness in dry van capacity. Furthermore, when pandemic data from 2021 and 2022 is excluded, current equipment availability is 41% below the long-term average recorded since 2017.