All rates cited below exclude fuel surcharges, and load volume refers to loads moved unless otherwise noted. The rate charts exclude 2021 and 2022 years influenced by the pandemic. Analysis for the week ending Saturday, May 23rd, 2026, week 21.
North America added two rigs last week per Baker Hughes’ May 8 count, with Texas driving the gain and the Permian Basin adding one. It’s a meaningful reversal after a brutal stretch — North America shed 96 rigs between mid-February and mid-April as operators pulled back on tariff uncertainty and softening crude. The year-over-year picture tells the deeper story: the U.S. oil rig count is down 57 rigs from a year ago, a structural drag on one of flatbed’s most reliable demand engines. Drill pipe, casing, compressors, and wellhead equipment all move on flatbeds, and every active rig generates roughly 10–15 flatbed moves per month.
Get the clearest, most accurate view of the truckload marketplace with data from DAT iQ.
Tune into DAT iQ Live, live on YouTube or LinkedIn, 10am ET every Tuesday.
The Houston–Lubbock lane is a real-time read on oilfield equipment flow into the Permian, and DAT RateView shows the market responding. The 7-day average spot flatbed rate on that corridor is $4.13 per mile all-in as of May 11 — up 33% from $3.10/mile a year ago. Rates softened modestly through April’s tariff-driven uncertainty but have firmed heading into May as rig additions resume and capacity exits the market due to regulatory and enforcement headwinds.
The Permian peaked above 350 active rigs in 2022 and is running well below that today. The headroom for recovery is real, and if operators continue adding iron through Q2, lanes serving Midland-Odessa will see continued rate support. For flatbed carriers and brokers covering Texas oilfield corridors, the Baker Hughes rig count isn’t just energy sector news — it’s a leading indicator for your book of business.
National flatbed spot rate trends
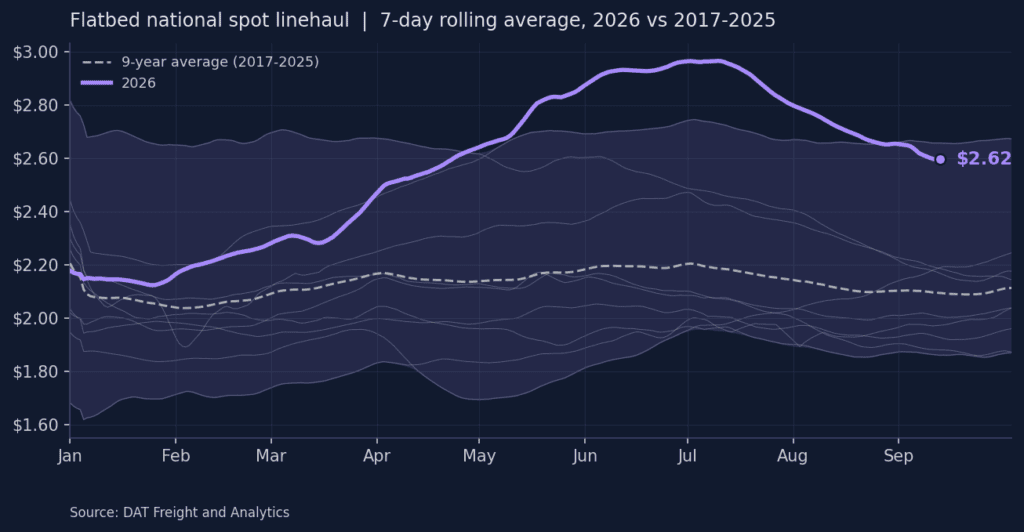
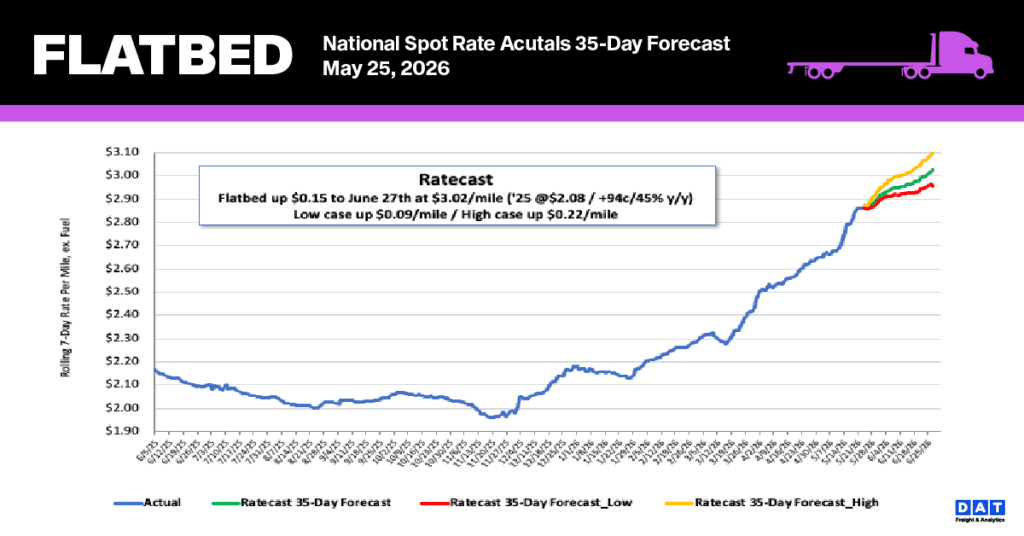
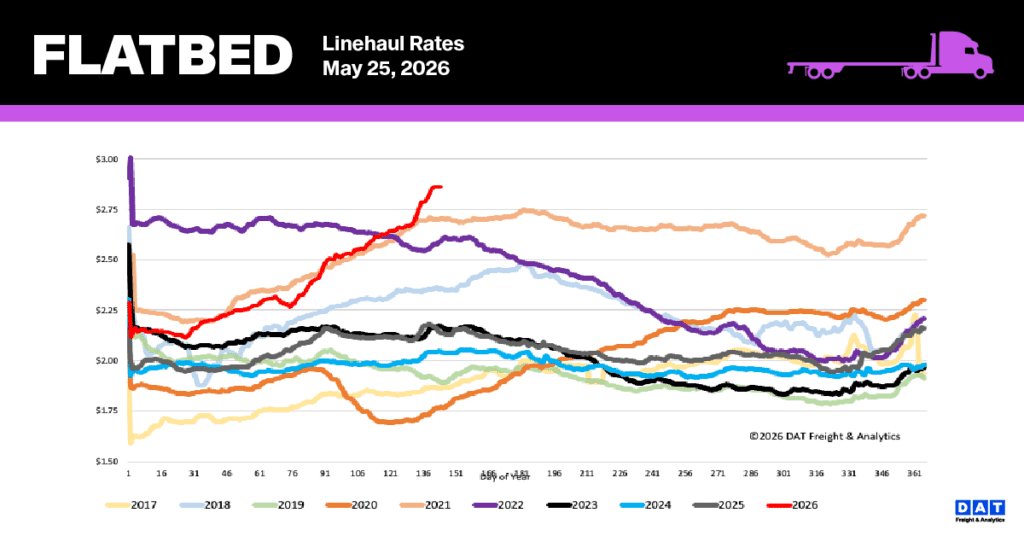
National spot rates for the flatbed sector reached a record $2.87 per mile last week, marking a $0.07 increase as capacity remains constrained. This milestone follows ten consecutive weeks of expansion, during which rates climbed by $0.56 per mile (21%), ultimately surpassing the previous high established in June 2021 by $0.11.
Compared to historical data, current pricing is significantly elevated: rates are currently 34% ($0.73) higher than this time last year and 30% ($0.87) above the five-year average when excluding pandemic-related volatility. These record-setting figures highlight the ongoing tightening of available flatbed capacity across the national 7-day rolling average.
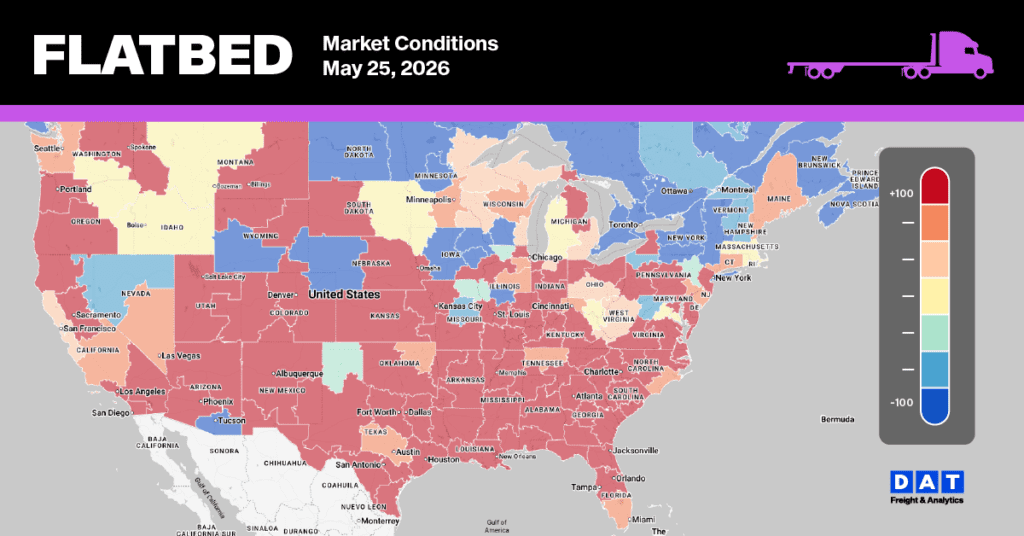
Flatbed Market Conditions
Market capacity in the flatbed sector recovered as carriers returned following Roadcheck Week, evidenced by an 18% surge in equipment posts that brought availability back to pre-inspection levels. Although load post volumes experienced a minor 3% weekly decline, they persist at levels 10% above pre-Roadcheck benchmarks and 57% higher than the previous year. These shifting supply and demand dynamics resulted in an 18% drop in the flatbed load-to-truck ratio, which finished the week at 71.20.