The big picture
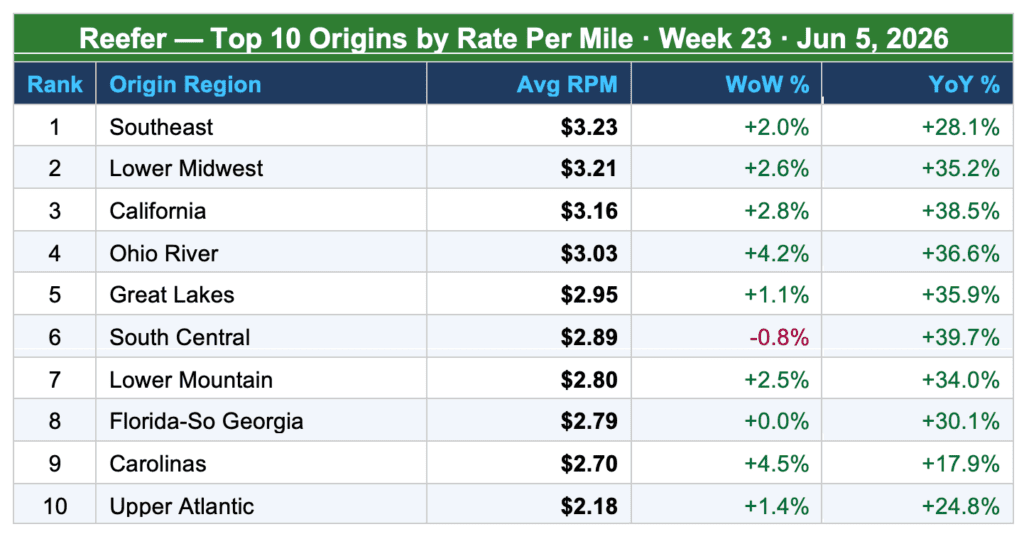
Florida’s Shortage-era rate spike is unwinding — fast. After a two-week surge that sent rates on key corridors up 14–42% and cemented full Shortage conditions, the June 9 report shows Florida pulling back across every lane it covers, with some corridors giving back 7–10% in a single week. This is not a market collapse; it’s a correction. Florida’s load pool is thinning as the summer wind-down accelerates, and the market priced in tight capacity aggressively in late April and May. Now, with fewer loads moving out of the peninsula and South Texas absorbing more of the perishable freight volume, the arbitrage has shifted. The bigger story this week may be South Texas, where rates fell sharply — down as much as -23% on the LA lane — signaling that the brief tightening cycle there has reversed as well. Meanwhile, all California districts held their Slight Shortage status with largely flat rates, a quiet but structurally important signal that West Coast capacity remains constrained. Yakima is the week’s underdog story: the Pacific Northwest is nudging rates higher to the Northeast corridor, quietly adding 6–8% on lanes to Baltimore, New York, and Philadelphia, with cherries and asparagus driving the load pool.
1. Central & South Florida — Shortage | ⚠️ Rate correction underway
Florida remains in full Shortage — the tightest designation on the USDA scale — but rates fell across every lane this week as the season accelerates toward close. The commodity mix (watermelons, tomatoes, squash, peppers, sweet corn, cantaloupes, okra) remains summer-forward, but the volume available to truck is contracting. Last week’s New York lane spike of +105% (one of the most extreme single-week moves in recent memory) has partially unwound; the lane is still elevated on a multi-week basis but gave back -7% this week.
Trend context: Florida has now posted back-to-back weeks of rate declines after a historic spring run-up. The Atlanta lane, the most volume-sensitive short-haul indicator, has shed -10% — a meaningful signal that close-haul demand is softening. Watch for whether load availability drops faster than rates, which would indicate the season close is accelerating ahead of schedule.
2. Mexico crossings through South Texas — Adequate | ⚠️ Sharp reversal
South Texas flipped direction hard this week. After holding relatively stable the past two weeks, rates fell sharply on multiple lanes — most notably -23% to Los Angeles, -19% to Atlanta, and -15% to Chicago. The Adequate truck availability designation held (no tightening), suggesting the drop reflects load-side softening rather than a capacity influx. The commodity mix remains robust: watermelons, peppers (all varieties), tomatoes, limes, pineapples, and cucumbers. Dallas held flat, which is consistent with Dallas being the highest-frequency, lowest-cost destination from South Texas and therefore the least reactive to volume shifts.
3. California coast (all districts) — Slight Shortage | Rates largely flat
All five California shipping districts — Imperial/Coachella/Calexico/San Luis, Kern, Oxnard, Salinas-Watsonville, Santa Maria, and South & Central — maintained Slight Shortage truck availability this week, and rates were mostly flat to slightly negative. The structural story here is stability: California has now held Slight Shortage conditions for multiple consecutive weeks with minimal rate movement. That’s a quiet signal that shippers have adapted to the constrained capacity environment and carriers are not pushing for additional gains.
The notable exceptions were softness on a few Northeast-bound lanes out of Salinas-Watsonville and South & Central District, where rates pulled back 7–10% to Baltimore and New York. Given that these are among the highest-dollar corridors, even single-digit pullbacks represent meaningful dollar changes per load.
4. Yakima Valley & Wenatchee — Adequate | Northeast rates creeping up
Yakima is the quiet gainer this week. While Florida and South Texas correct and California holds flat, Yakima nudged rates higher on Northeast-bound lanes — a modest but consistent move. The commodity mix of cherries, apples, asparagus, pears, and rhubarb reflects early summer peak for the district. Cherry season is the likely driver: high-value, time-sensitive loads that compress available capacity and support rate firmness.
5. Nogales (Mexico crossings through Arizona) — Adequate | Flat week
Nogales held Adequate truck availability with rates largely stable. Cucumbers, grapes, honeydews, mangoes, and tomatoes make up the commodity mix. No week-over-week percentage changes were reported this week (parentheses blank), meaning USDA had insufficient data to calculate changes or the market was essentially unchanged from last week’s adjusted baseline.
6. Vidalia District, Georgia — Adequate | Season in full swing, rates flat
Vidalia onions remain in steady Adequate condition with zero rate movement on any lane this week. The pack window, which typically opens around April 13 and runs through late June/early July, is now in its prime volume phase. Rates flat across all 9 destinations.
What this means for carriers, shippers & brokers
For Carriers: Florida’s correction is real, but don’t confuse a rate pullback with a market collapse — Shortage conditions are still in place and the Florida load pool is shrinking, not growing. Fewer loads available means fewer opportunities to be selective, even if per-load rates dip. Position now for the Southeast-to-Midwest pivot that typically follows Florida’s seasonal close: South Texas and Nogales will absorb displaced produce volume through June and July, making those lanes increasingly important for network planning. Yakima is worth watching as cherry season builds — Northeast-bound rates out of the Pacific Northwest are ticking up with room to run if cherry volumes surge.
For shippers: This week’s rate relief in Florida and South Texas is real but likely short-lived. Florida Shortage designation remains in place even as rates soften — the underlying capacity story hasn’t changed, and as the load pool contracts toward season close, any surge in late-season volume (watermelons, final sweet corn runs) could push rates back up quickly. California flatlines are good news for budget certainty: Slight Shortage conditions with minimal rate movement give shippers a stable planning baseline. Lock in California capacity now before any weather or transition events disrupt the summer supply chain. The Salinas-to-Nogales handoff for leafy greens is worth watching as June progresses.
For brokers: The South Texas rate correction — especially the -23% LA lane and -19% Atlanta lane — creates a short-term arbitrage window if you have carrier relationships priced off last week’s elevated levels. Move quickly; those carriers will reprice. On the Florida side, watch the Atlanta lane as a leading indicator: at -10% this week, it’s the canary for whether the broader Florida correction has further to run or stabilizes. The Yakima Northeast surge (Baltimore, New York, Philadelphia all up 6–8%) is an opportunity to get ahead of cherry-driven tightness — if you’re covering Pacific Northwest produce, now is the time to shore up capacity before rates climb further.
National reefer spot rate trends
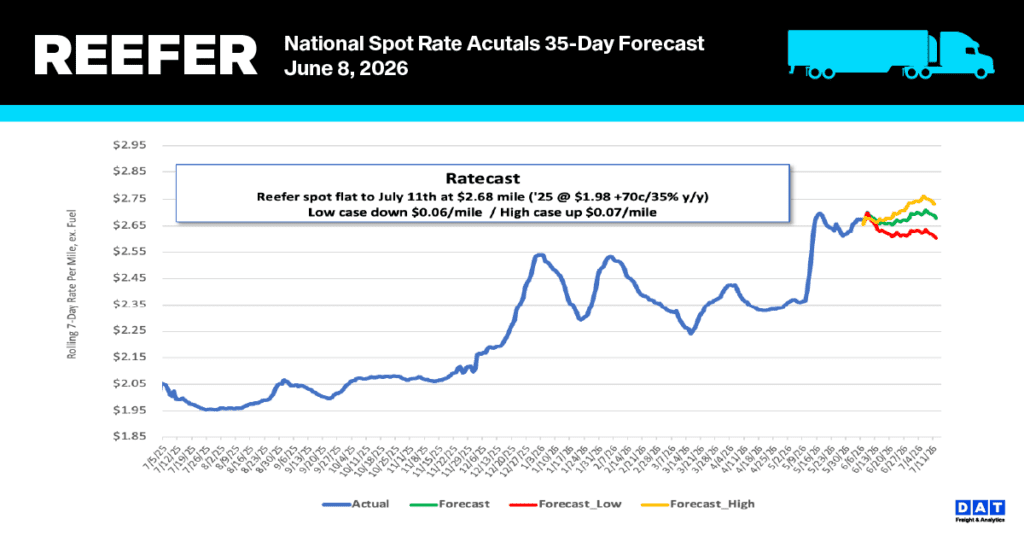
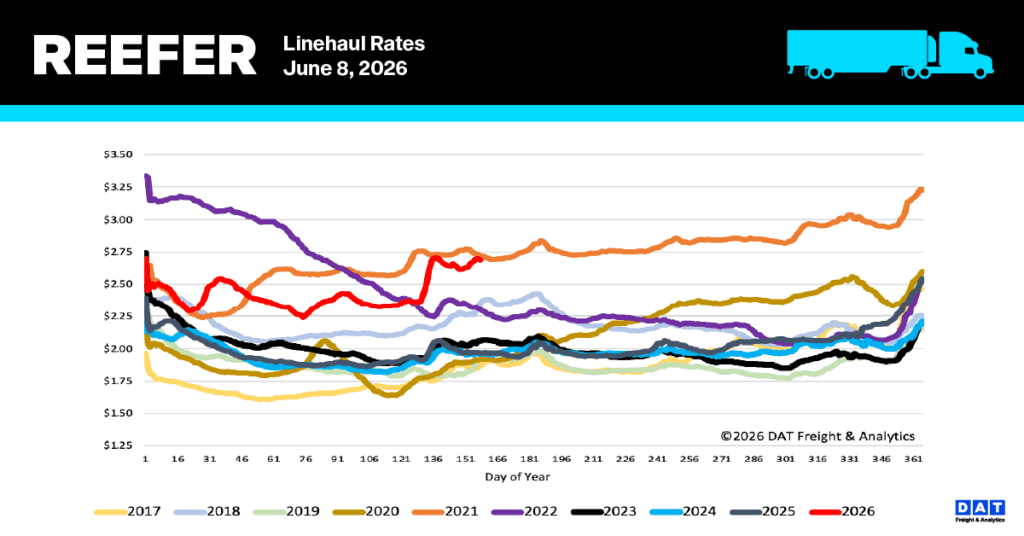
National refrigerated linehaul rates increased by $0.06/mile last week, bringing the 7-day rolling average to $2.69 per mile. Market performance continues to be notably strong, sitting 37% ($0.72) higher than last year and 27% ($0.72) above the non-pandemic five-year average. While current spot rates have increased by $0.33 per mile (14%) since before Roadcheck Week, they remain just $0.03 under the Week 22 record established in 2021.
In major produce hubs, the average spot rate for transporting fruits and vegetables is currently $4.16 per mile. This figure represents a week-over-week increase of approximately $0.27 per mile, $0.85 higher than the rates recorded during the same period in the previous year.
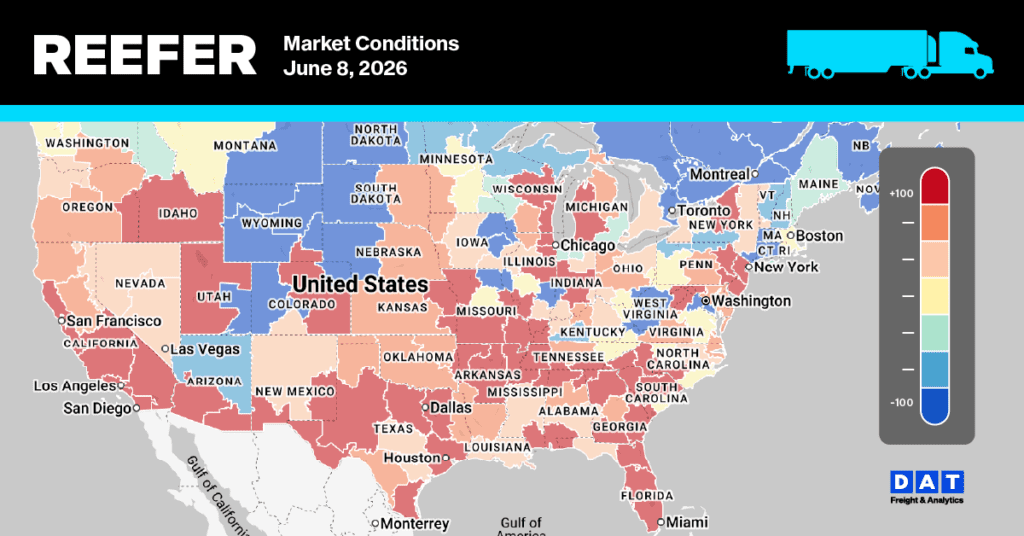
Reefer Market Conditions
Refrigerated sector capacity is currently in a stabilization phase as equipment availability improves following the holiday-shortened week. Although supply is on a recovery path, equipment postings are down 19% compared to the same timeframe last year. In contrast, load postings have experienced a significant year-over-year increase of 57%, resulting in a 9% reduction in the load-to-truck ratio, which now stands at 17.61.