The truckload sector is currently trapped in a tale of two entirely different economies, leaving many carriers dealing with an incredibly fragmented market. On one side, traditional consumer-facing freight remains under immense pressure. As retail demand fluctuates and discretionary goods movement slows down, April retail data highlighted an overall spending drop of 1.6% year-over-year, with unit demand plummeting 4.7%. Compounding this, the University of Michigan Consumer Sentiment Index plunged to a historic low of 44.8% in May 2026, with well over half of consumers explicitly citing high prices as a severe strain on their personal finances. For carriers heavily reliant on big-box retail and consumer packaged goods, this translates to tight inventory cycles, soft volumes, and highly competitive spot market conditions.
Get the clearest, most accurate view of the truckload marketplace with data from DAT iQ.
Tune into DAT iQ Live, live on YouTube or LinkedIn, 10am ET every Tuesday.
Conversely, a parallel industrial boom is driving unprecedented, surging demand for specialized truckload capacity. The rapid expansion of AI infrastructure has ignited one of the fastest industrial construction ramps in modern U.S. history, creating a massive logistical need for specialized transport. Freight networks are seeing significant volume increases tied directly to data center development, power grid expansions, and semiconductor supply chain logistics. Carriers positioned to move heavy structural steel, concrete modules, massive electrical transformers, switchgear, and complex liquid cooling infrastructure are experiencing a structural boom. Success in today’s truckload landscape ultimately depends on which side of this economic divide your fleet is running—making lane diversification and specialized asset deployment more critical than ever.
Spot rate trends
Note: Load volume represents loads moved and all cited rates exclude fuel surcharges. Analysis excludes pandemic-impacted years (2021-2022).
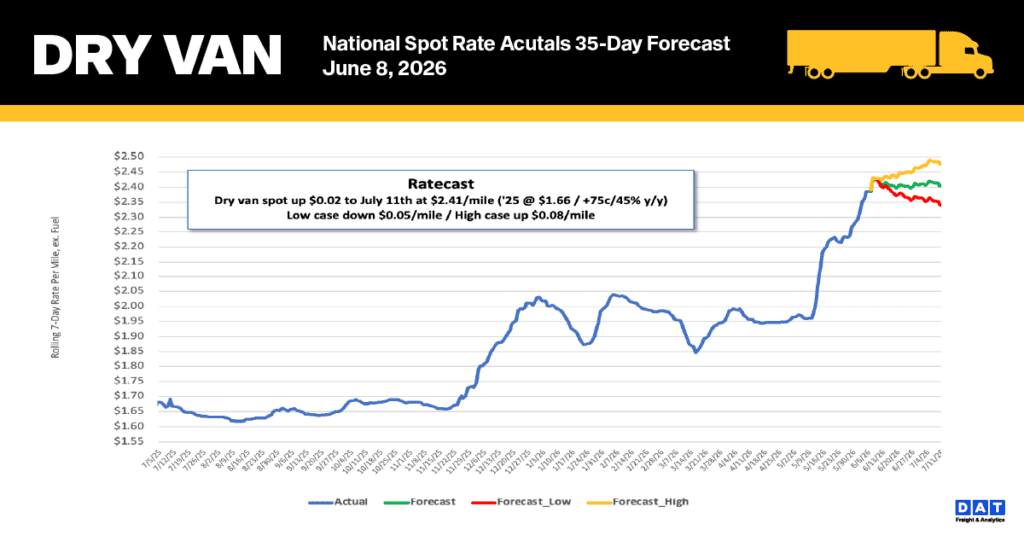
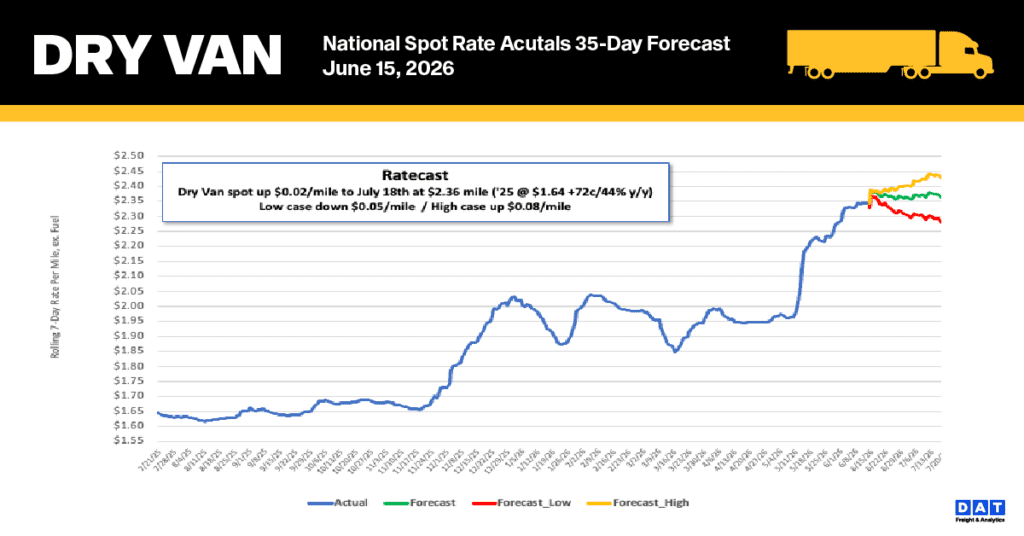
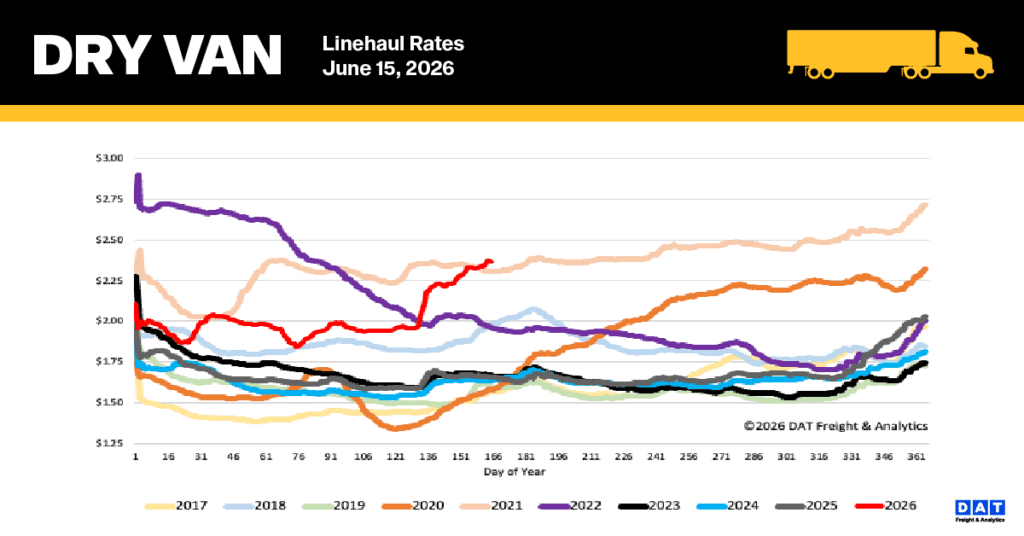
After a seven-week expansion that saw the 7-day rolling average climb by $0.40 per mile—largely driven by Roadcheck Week—the national dry van market decelerated slightly last week. Spot rates dipped $0.01 to end at $2.37 per mile. Despite this minor pullback, the current rate represents a record for Week 24, exceeding the previous 2021 peak by $0.06. This average remains significantly elevated, sitting 42% ($0.71) higher than last year and 31% ($0.73) above the five-year non-pandemic average.
Segment & regional market breakdown
- Core Midwest market: Rates in this 13-state bellwether region, which accounts for nearly half of the nation’s load volume, decreased by $0.07 per mile to an average of $2.76 as capacity constraints eased across primary corridors.
- Top-tier lanes: Capacity gains effectively neutralized the previous week’s gains on DAT’s top 50 monitored lanes, where the average rate dropped $0.11 per mile to settle at $2.76.
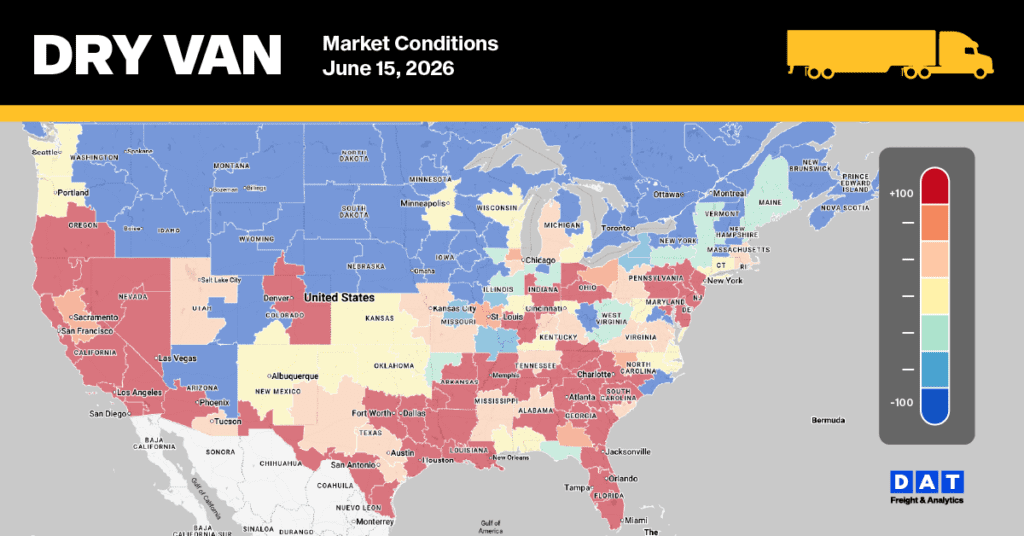
Dry Van Market Conditions
The urgency to secure capacity and position loads in major freight markets ahead of Independence Day celebrations appears to have eased, following a 15% drop in load post volumes. Equipment posts fell by 5% and 20% lower than a year ago as capacity continues to exit the market, which contributed to the national dry van load-to-truck ratio dropping 10% to 9.06. this past week.