Two weeks ago, World Cup host city reefer rates and the rest of the country were rising together — host cities just a step ahead. That has changed. As the tournament moved deeper into the group stage and the bracket began concentrating eastward, the two lines decoupled. Host city rates kept climbing. The rest of the country rolled over.
The result is the clearest evidence yet that World Cup freight demand is doing something the broader summer market is not. And it is moving on temperature-controlled trailers because the World Cup runs on cold freight: kegs and cases of beer, pallets of chicken wings and burger patties, fresh produce for stadium kitchens and fan-fest grills, ice cream, bottled drinks, and the prepared foods stocking every bar and grocery store in a host city. When 60,000 fans fill a stadium and tens of thousands more pack the surrounding bars and watch parties, the reefer freight required to feed and pour for them all has to arrive first — and it is arriving in volume.
The lines have decoupled
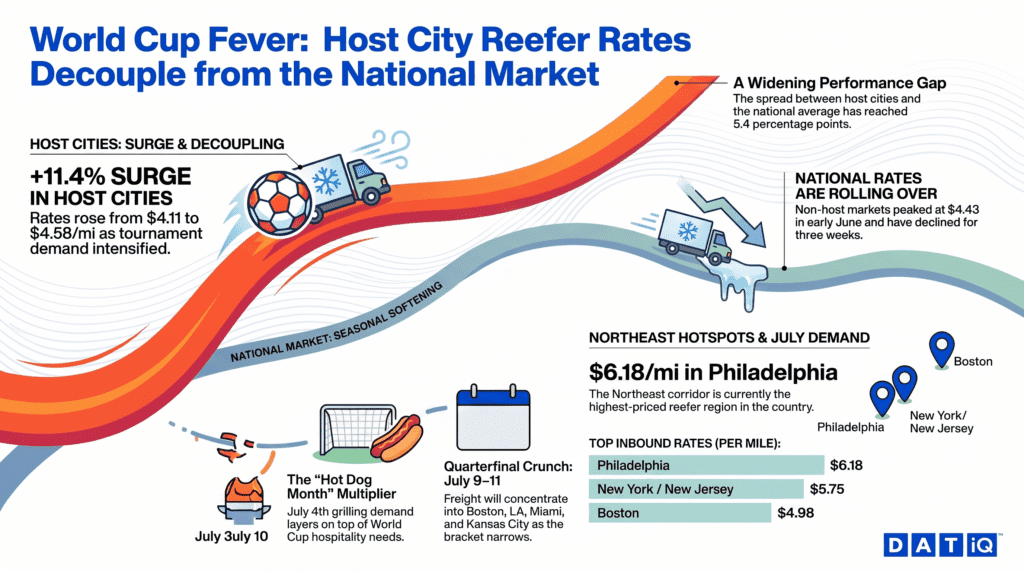
Since the week of May 4, inbound reefer rates into the 11 World Cup host city markets have risen +11.4%, from $4.11/mi to $4.58/mi on a 7-day rolling basis — a fresh high for the tournament window. Over the same period, rates into all other U.S. markets rose just +6.0%, from $4.08/mi to $4.33/mi.
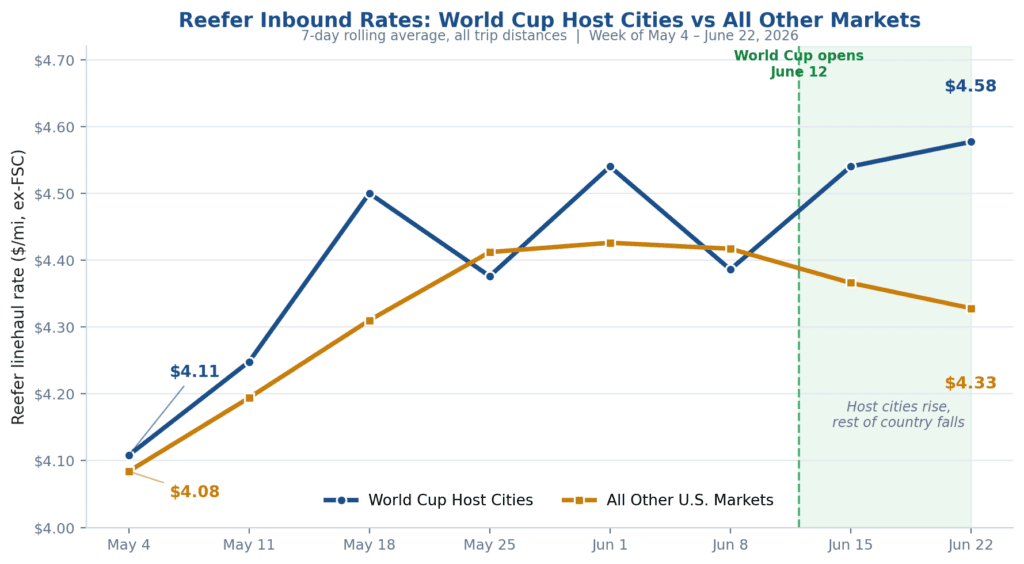
Figure 1. Reefer inbound linehaul rates, World Cup host cities vs all other U.S. markets (7-day rolling, all distances, ex-FSC). Source: DAT FACT_RATES_CALCULATIONS.
More telling than the gap is the direction. Non-host markets peaked the week of June 1 at $4.43/mi and have since declined three straight weeks to $4.33/mi, the normal summer reefer softening as produce season winds down. Host city markets did the opposite — holding through mid-June and pushing to a new high of $4.58/mi the week of June 22. The spread between the two has widened from 2.5 percentage points in mid-June to 5.4 percentage points today.
The Northeast Corridor is where the money is
New York/New Jersey — home to MetLife Stadium and the July 19 final — has pushed to $5.75/mi, a fresh high and the second-most expensive reefer market in the host city group. With the final three weeks out and knockout matches concentrating in the Northeast, that rate is likely to keep climbing.
Philadelphia remains the highest-priced reefer market in the country at $6.18/mi, though it has eased off its June 15 peak of $6.51/mi. Boston set a new high at $4.98/mi the week of June 22 — up nearly 5% in a single week. With Scotland still in contention as the group stage plays out and a quarterfinal scheduled at Gillette Stadium on July 9, the Tartan Army’s well-documented appetite shows no sign of easing.
Miami surges ahead of its quarterfinal
Miami was the biggest single-week mover, jumping +10% to $3.79/mi the week of June 22. Hard Rock Stadium hosts a quarterfinal on July 11, and the rate data suggests event logistics are beginning to build well ahead of the match. San Francisco (Levi’s Stadium) also climbed to $4.79/mi, supported by the overlap of California produce freight and tournament demand.
Not every market is rising. Seattle eased to $3.97/mi and Atlanta slipped slightly to $4.58/mi, both cooling modestly after strong runs earlier in June. Kansas City held at $3.27/mi — still up sharply from its early-May baseline of $2.62/mi as Arrowhead Stadium prepares for a July 11 quarterfinal.
California: still a produce story first
Los Angeles runs at $4.21/mi on an all-distances basis — a market that looks weak on long-haul data alone but reflects dense short-haul produce activity out of the Salinas and San Joaquin valleys. SoFi Stadium hosts a quarterfinal on July 10, and the combination of peak produce season and tournament hospitality demand continues to keep Southern California reefer capacity tighter than the long-haul numbers suggest.
July: When the bracket meets National Hot Dog Month
The timing could not be better scripted for freight. The World Cup knockout rounds run through July — and July is National Hot Dog Month, capped by the single biggest food day of the American calendar. Americans eat an estimated 150 million hot dogs on July 4 alone, and the tournament puts its biggest matches in exactly the cities that eat the most of them.
New York leads the country in retail hot dog spending at roughly $116 million a year. Los Angeles is second at $96 million, consuming nearly 28 million pounds of hot dogs annually — more than any other city. Both are World Cup host markets: LA hosts a quarterfinal July 10, and New York/New Jersey hosts the final July 19. Layer World Cup hospitality demand on top of peak summer grilling season and National Hot Dog Month, in the two largest hot dog markets in America, and the reefer freight math gets loud. Every one of those franks moves cold, and it moves before the whistle.
What to watch: quarterfinals begin July 9
The group stage runs through July 2. Four quarterfinals follow — Boston (July 9), Los Angeles (July 10), Miami and Kansas City (July 11) — before the semifinals in Dallas and Atlanta and the final at MetLife on July 19. As the bracket narrows to eight teams and then four, freight demand will concentrate into fewer markets, and the Northeast corridor is positioned to absorb the most pressure.
For carriers on reefer lanes into the Northeast: New York/New Jersey, Philadelphia, and Boston are the best-paying inbound markets in the country right now, and the trajectory through the final is upward. For brokers and shippers: host city capacity is tightening while the rest of the country softens. Lock in Northeast and quarterfinal-market coverage before July 9.
DAT will publish a final read after the tournament concludes July 19.