The farm economy is sending a clear warning signal to flatbed carriers who haul agricultural equipment. U.S. retail sales of farm tractors fell 21.6% in May compared to a year ago, with self-propelled combine sales collapsing 56.1% in the same period. Year-to-date numbers aren’t offering any relief either — total farm tractor sales through May are down 12.4% versus the same stretch in 2025, and combines are off 14.6% on a YTD basis. This isn’t a one-month blip. It’s a pattern reflecting sustained pressure on farm income, and it has direct consequences for the flatbed carriers and brokers who move this iron.
Get the clearest, most accurate view of the truckload marketplace with data from DAT iQ.
Tune into DAT iQ Live, live on YouTube or LinkedIn, 10am ET every Tuesday.
The root cause is the farm economy itself. AEM Senior Vice President Curt Blades noted that farmers are hurting, equipment sales are a clear reflection of the overall health of the farm economy, and depressed commodity prices are suppressing demand. Trade policy uncertainty has compounded the problem, leaving farmers reluctant to commit capital to major equipment purchases. When a grower delays replacing a combine or holds off on a new row-crop tractor, those loads simply don’t move. Flatbed carriers serving the ag equipment OEM corridor — think Central Illinois, Indiana, Iowa, and the Eastern Plains — feel that demand destruction immediately in the form of fewer tender opportunities and softening rates on lanes tied to manufacturer distribution networks.
The silver lining for carriers watching this space: inventory levels are still elevated. Beginning inventory for May stood at 94,191 total farm tractors and 714 combines — equipment that’s already been built and needs to eventually reach dealers and end users. When farm income stabilizes and trade uncertainty clears, there could be a meaningful flush of pent-up equipment moves. Until then, flatbed capacity chasing agricultural machinery freight should expect continued softness in spot availability from OEM shipping points, and those with contract exposure to ag equipment lanes will want to watch the June and July AEM prints closely for any sign of reversal.
National flatbed spot rate analysis
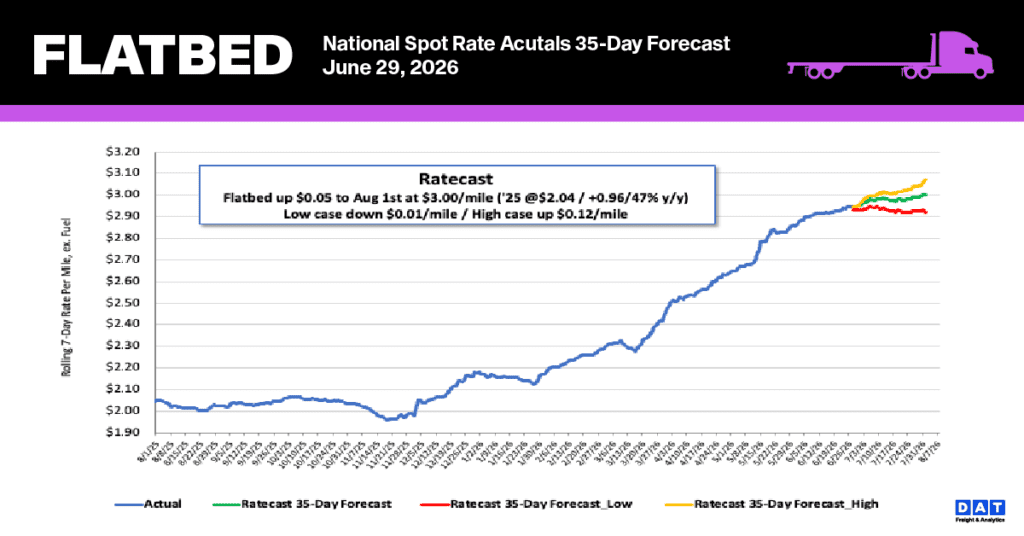
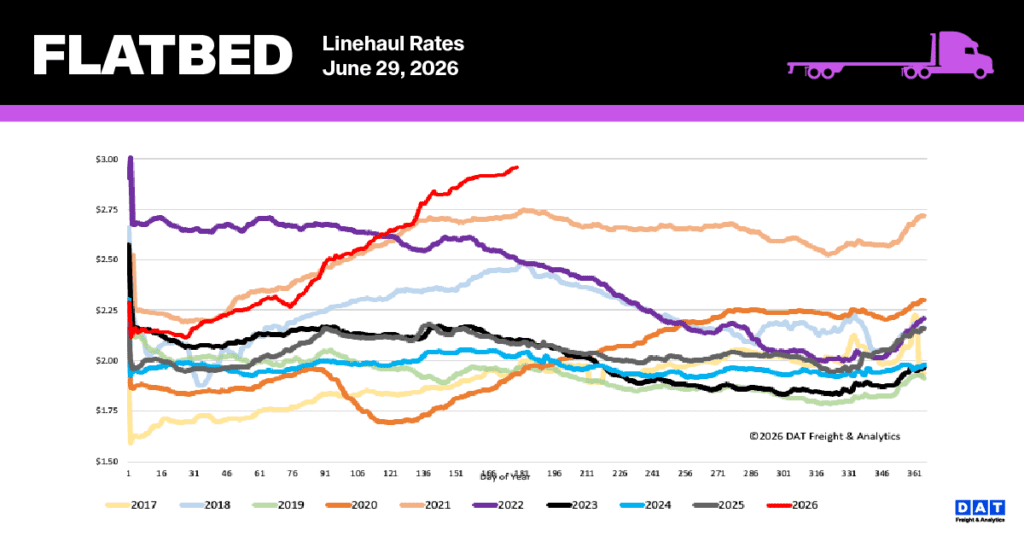
As a seasonal plateau begins to take shape, national flatbed spot rates continue to hold at record-shattering levels. The 7-day rolling average climbed by $0.02 per mile last week to reach $2.96, steadily approaching the $3.00 milestone. Current pricing remains well above historical benchmarks, outpacing last year by 42% ($0.88) and the non-pandemic five-year average by 31% ($0.93). Additionally, these rates are now 8% ($0.21 per mile) higher than the previous record set in 2021.
- Regional bellwether performance (TX, GA, PA, AL, OK, IL, TN, SC, AR, CA): Rates in this vital 10-state industrial corridor—which accounts for nearly 55% of national load volume—softened by $0.03 to an average of $3.53 per mile as route capacity loosened.
- Market significance: These bellwether states encompass the nation’s primary steel mills, energy hubs, and building-product plants. While the heavy nature of metals, energy, and construction freight causes weekly volatility, key markets like Texas, Georgia, and Alabama remain the most reliable indicators of the national flatbed rate trajectory.
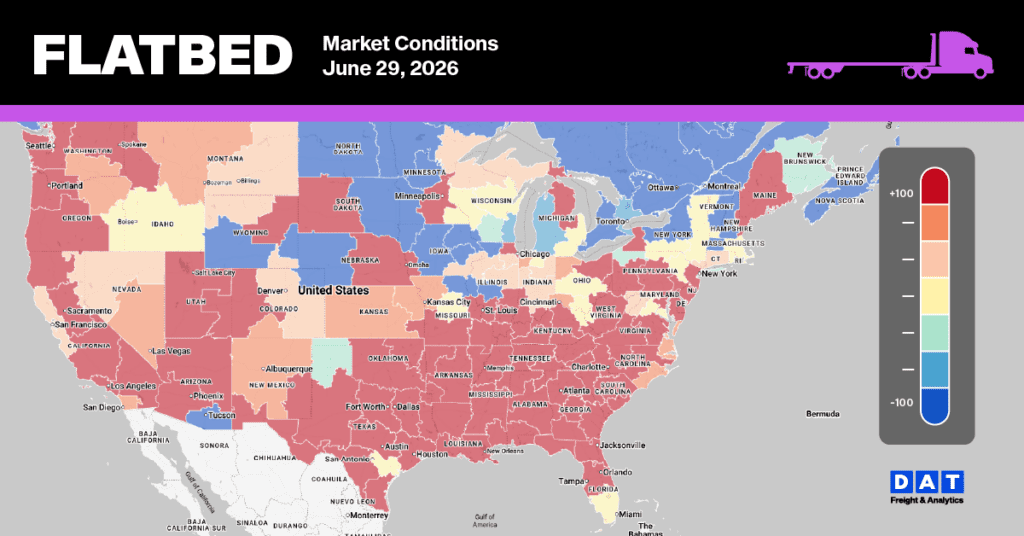
Flatbed Market Conditions
The flatbed market is currently demonstrating a seasonal summer plateau, characterized by a 3% decrease in weekly load postings and a cumulative 10% drop over the last month. Even with this softening, activity levels remain strong—climbing 65% year-over-year and exceeding non-pandemic historical averages by 21%. Because equipment availability tightened by 10% last week, the load-to-truck ratio rose 7% to reach 58.12. This figure represents a 131% increase over the previous year, despite marking the second week in a row that the ratio has eased.