The April trucking ton-mile index reveals that the recent spike in trucking freight rates is almost entirely supply-side driven, rather than a reflection of robust aggregate freight demand. The seasonally adjusted ton-mile index showed a very sluggish 0.2% growth both month-over-month and year-over-year, which drastically underperforms historical demand expansions like the 3.5% jump seen in 2018. What little demand growth exists is highly concentrated in sectors supporting AI computing infrastructure buildouts, while categories tied to consumer spending remain weak. This fragile demand is expected to persist into May, as secondary industrial production data points to flatlining output outside of high-tech manufacturing.
In contrast to stagnant volume growth, implied revenue surged by 6.4% month-over-month and 14.0% year-over-year, an increase fueled almost exclusively by a historic surge in freight rates and elevated fuel surcharges. This disconnect highlights a precarious reality for carriers: the current revenue boom is heavily reliant on a single sector. If market sentiment cools and leads to a pullback in capital expenditures for the physical AI ecosystem, carriers will be left exceptionally vulnerable due to the widespread softness throughout the rest of the freight economy.
Get the clearest, most accurate view of the truckload marketplace with data from DAT iQ.
Tune into DAT iQ Live, live on YouTube or LinkedIn, 10am ET every Tuesday.
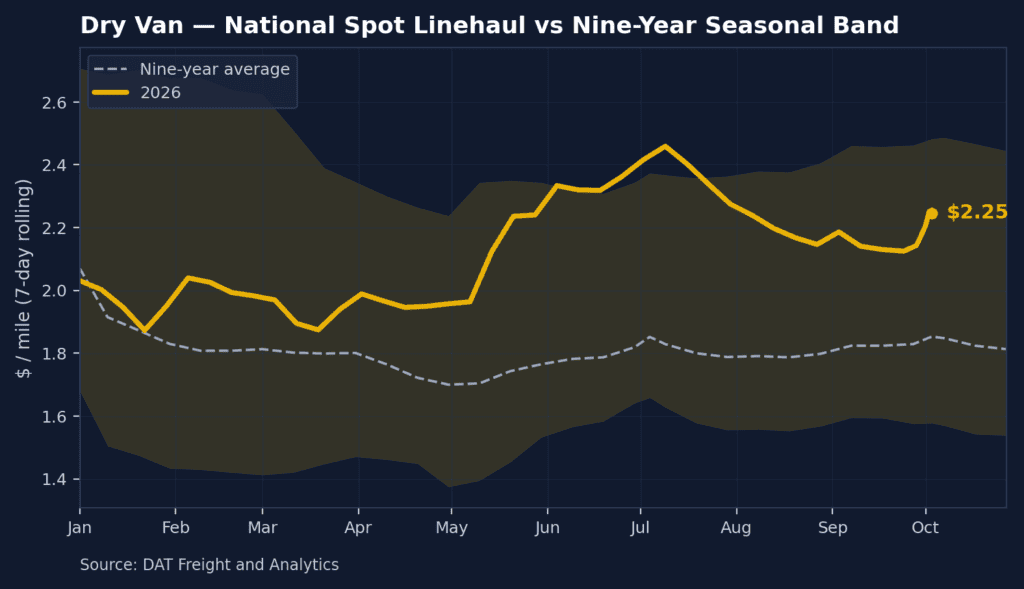
National dry van spot rate performance
Note: Load volume metrics reflect actual loads moved; all cited rates exclude fuel surcharges. This analysis omits the pandemic years of 2021 and 2022.
The national 7-day rolling average linehaul rate climbed by $0.07 last week, settling at $2.49 per mile. This increase was propelled by a surge in volume ahead of the July 4 holiday and a subsequent tightening of capacity. Dry van spot rates have jumped 24% since the time before Roadcheck Week, setting a record for Week 27 that surpasses the 2021 pandemic peak by $0.10. Current market pricing is notably high, standing 49% ($0.82) above last year and 31% ($0.77) higher than the five-year average for typical cycles.
Regional and lane analysis
- High-Volume Lanes: Pricing for DAT’s 50 highest-volume lanes rose by $0.13, reaching $3.06 per mile.
- Bellwether Regions (IN, IL, KY, TN, MO, OH, NC, VA, MI, MS): Rates in this essential 10-state market—responsible for 40% of national volume—gained $0.13 to average $2.98 per mile. This trend was driven by capacity constraints during the abbreviated workweek preceding Independence Day and the nation’s 250th Anniversary. These bellwethers represent the manufacturing and automotive core of the country, where plants produce consumer goods and distribution hubs disperse retail freight; shifts in these rates often signal broader changes in the national dry van market.
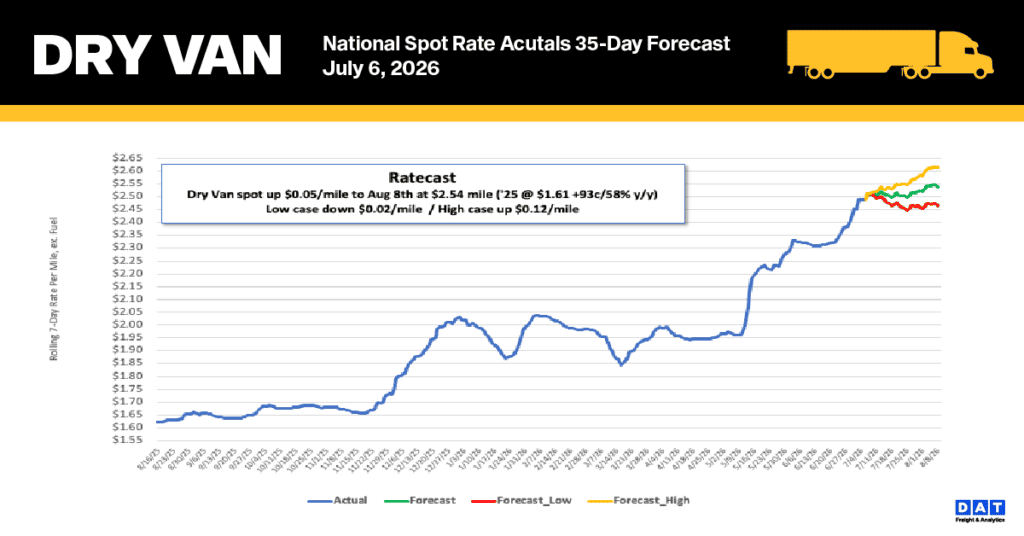
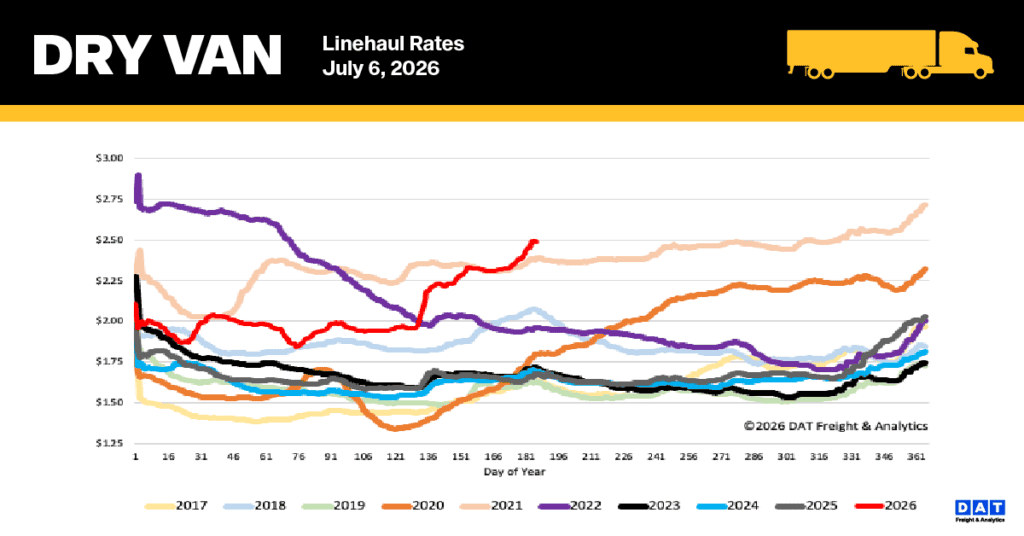
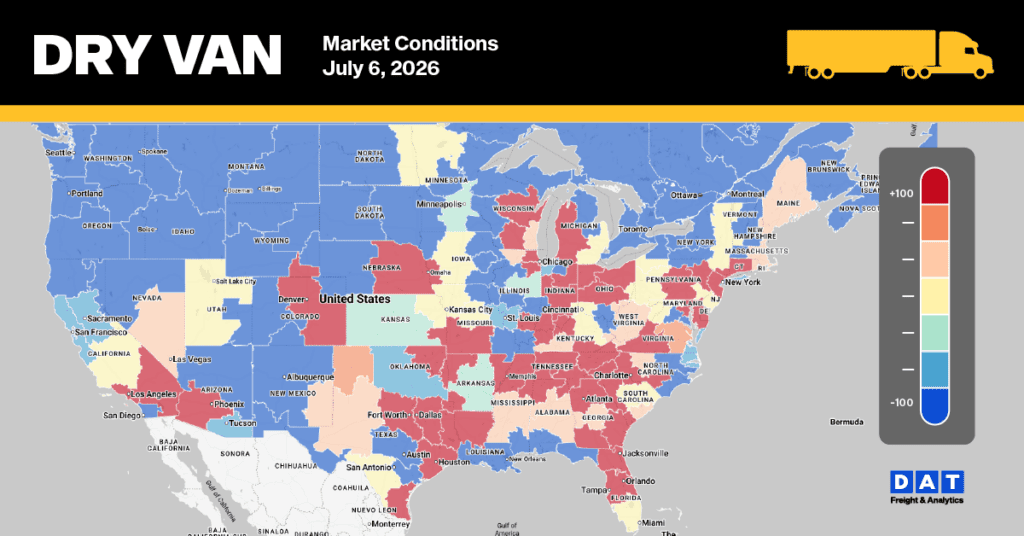
Dry Van Market Conditions
Driven by a combination of the U.S. 250th Anniversary during the Independence Day holiday, the close of the month and quarter, and persistent capacity constraints, load post volumes last week remained approximately 35% above previous year levels. Although this sustained contraction in supply caused the national dry van load-to-truck ratio to drop 13% to 11.16, the ratio remains nearly twice what was observed a year ago.