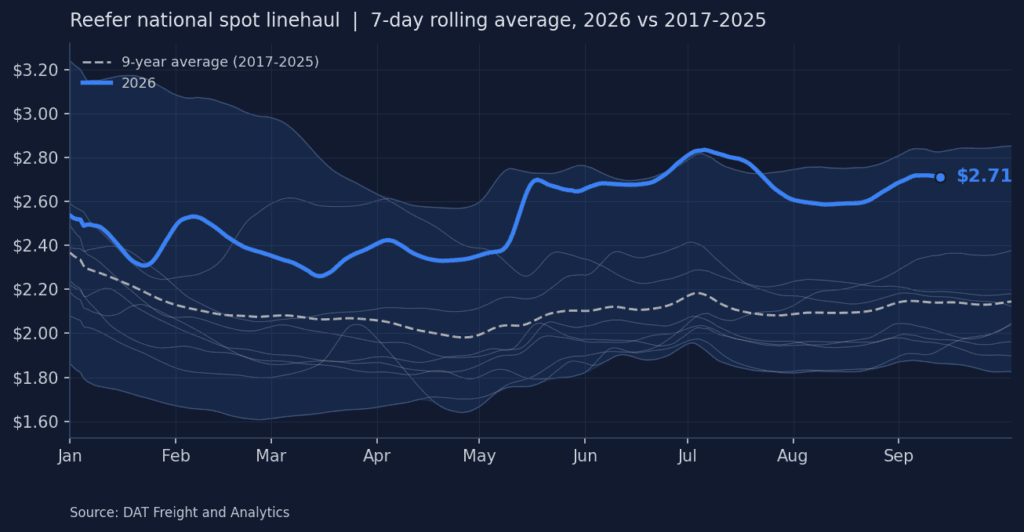
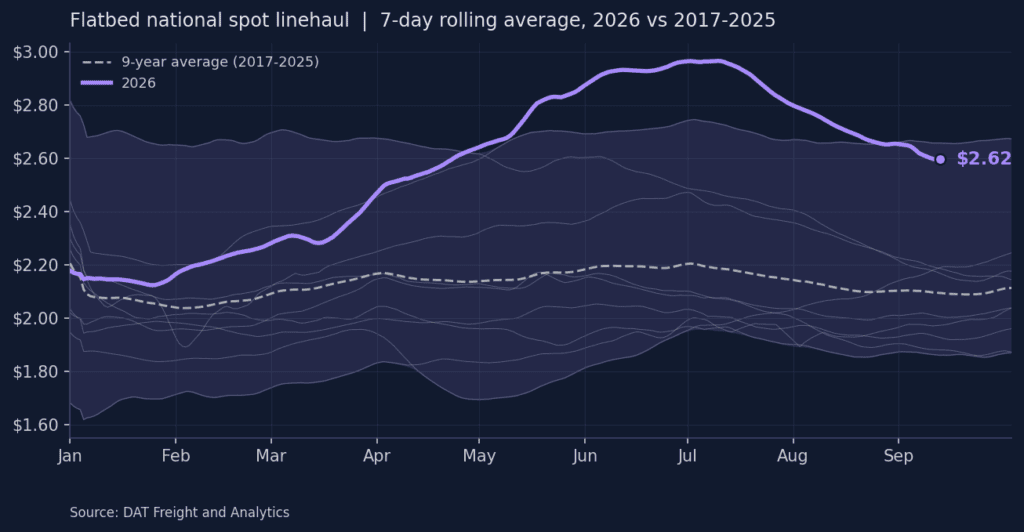
Every carrier, broker, and shipper trying to plan around today’s truckload market has been asking the same question: is this rate strength coming from tighter capacity, or is freight demand actually picking up? May’s trucking ton-mile index just made that question harder to answer with a simple “it’s supply.” Seasonally adjusted ton-miles jumped 0.7% month over month and 1.4% year over year in May, a sharper move than expected after volumes spent the back half of last year soft and only caught up to prior-year levels in the first quarter of 2026. That’s not the kind of number you get from capacity tightening alone. Something on the demand side is now pulling its weight too.
Get the clearest, most accurate view of the truckload marketplace with data from DAT iQ.
Tune into DAT iQ Live, live on YouTube or LinkedIn, 10am ET every Tuesday.
Professor Jason Miller went deep on the industries behind that gain, and a clear pattern showed up. The strongest year-over-year growth is concentrated in wholesale trade tied to equipment and industrial buildout: professional and commercial equipment is up 11%, electrical goods are up a striking 28.3%, and machinery and equipment is up 5.3%, with primary metals and machinery manufacturing both posting solid gains as well. Meanwhile, the freight categories tied to consumer spending and housing are still soft. Beverage manufacturing, furniture, paper, and wood products are all down year over year. In plain terms, the freight that’s growing right now is overwhelmingly the freight tied to building out AI computing infrastructure, not the freight tied to everyday consumer demand.
For carriers, brokers, and shippers, that distinction matters more than it might seem. It changes the split on why rates have been climbing from roughly 90% supply-driven and 10% demand-driven to something closer to 70/30, with nearly all of that demand contribution coming from one narrow source: capital spending on AI infrastructure. That’s a familiar setup, according to Prof Miller. The 2013-2014 freight cycle saw similar strength built on capex tied to the fracking boom, and when that spending unwound in 2015, a freight recession followed close behind. Nobody is predicting that outcome here, but the lesson is worth carrying into planning conversations: a meaningful share of today’s rate strength rests on a single capital spending cycle continuing. That’s worth watching closely as budgets and forecasts get built for the second half of the year.
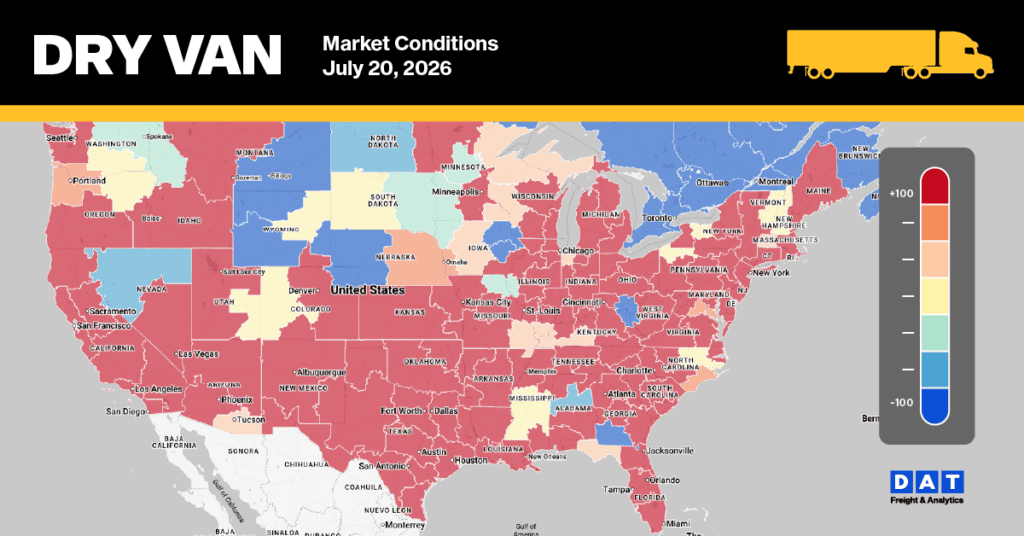
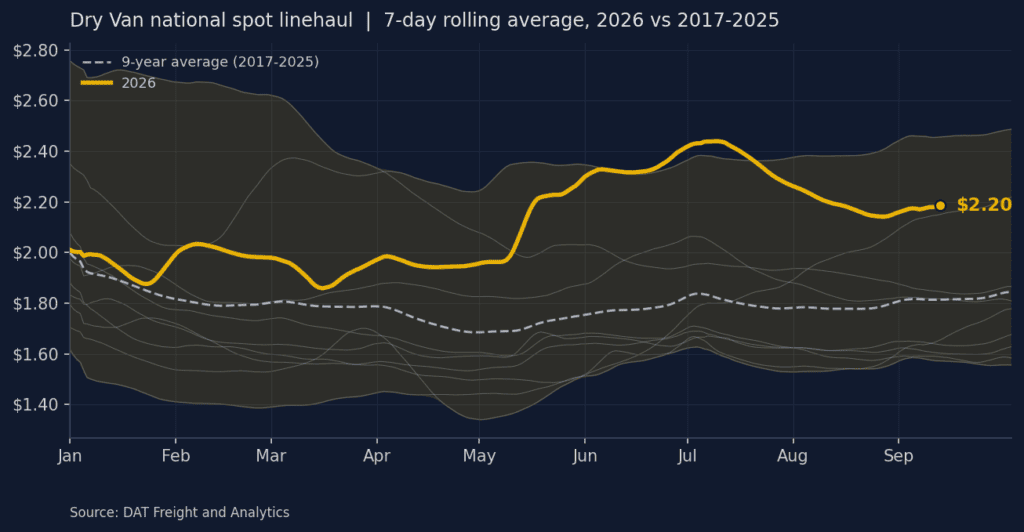
National dry van spot rate analysis
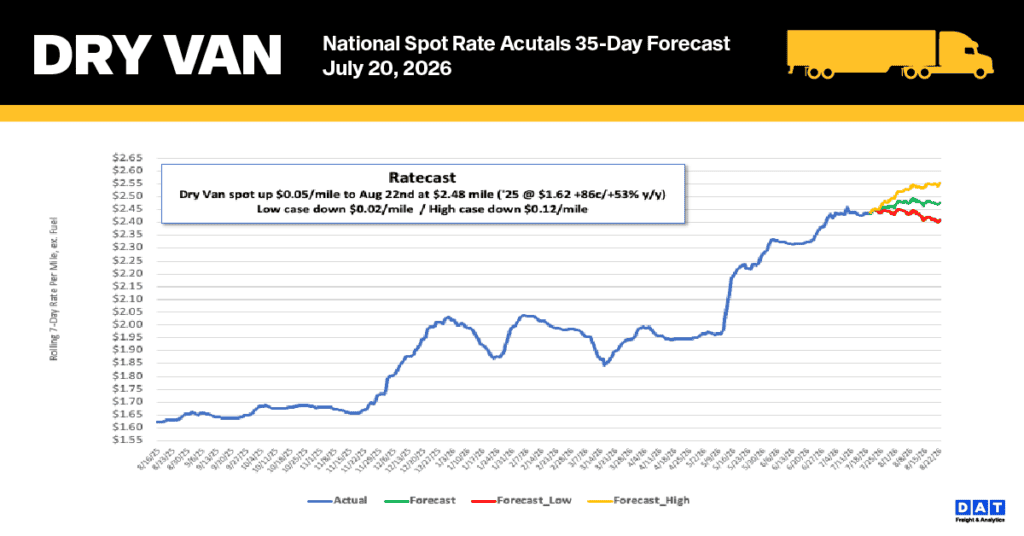
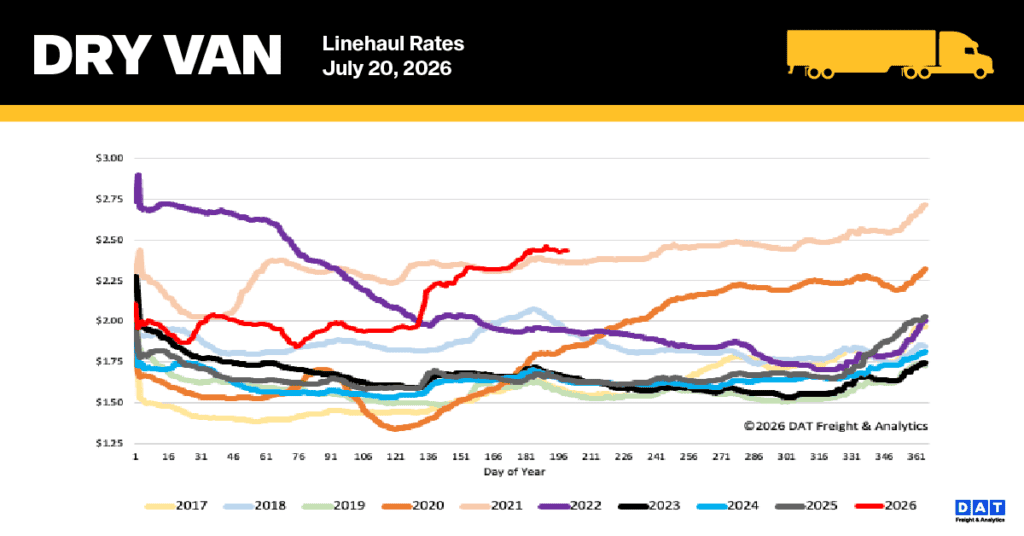
Following the historic high of the previous week, the national 7-day rolling average linehaul rate shifted past its seasonal peak, decreasing by $0.06 per mile to settle at $2.44 per mile. Spot market rates for dry vans remain 48% ($0.79) above last year’s figures and 32% ($0.77) higher than the five-year cyclical norm. Within the key Bellwether Markets (IN, IL, KY, TN, MO, OH, NC, VA, MI, MS), outbound rates for this vital 10-state corridor — which accounts for 40% of the nation’s overall volume — dropped by $0.12 to an average of $2.93 per mile.
Dry van market conditions
Load post volumes declined by 9% last week and remained almost identical compared to the week preceding the July 4 break, and 33% higher year-over-year. Truckload capacity is slowly returning to the market following last week’s national safety blitz, with equipment post volumes up 1% but still 14% below pre-holiday levels (July 4), the national dry van load-to-truck ratio experienced a 10% decrease, rising to 10.07.