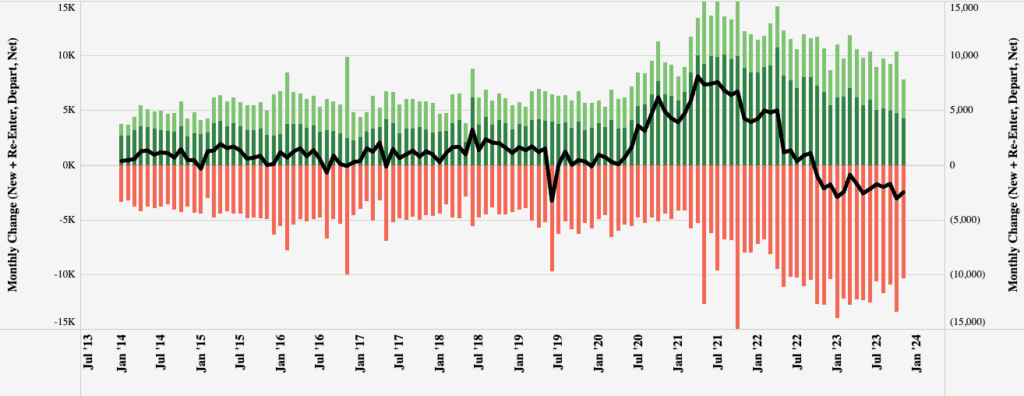
The rate of long-haul carriers exiting the industry slowed in November following the exodus reported by the FMCSA in October. As has been the case over the last few years, whenever there is a significant surge in diesel prices, carrier exits accelerate in the ensuing weeks as the cash flow crunch hits. The third-highest number of carriers revoked their operating authority in October following the 23% (or $0.86/gallon) spike in diesel prices between July 4 and mid-September. Since then, diesel has dropped 11% or $0.48/gallon, and that led to a slowing in industry exits in November.
FMCSA data shows the long-haul interstate sector lost ~500 fewer carriers in November compared to October as new and re-entrants levels fell back to pre-pandemic levels. New carrier rates (dark green in Figure 1 below) continue to decline and are down 39% year-over-year (y/y). Reactivated authority rates (light green) are down 17% y/y. Since the sector started losing capacity in October 2022, the industry has seen 168,000 carriers exit, while at the same time, 139,000 carriers entered the market for a net loss of 29,000. For context, this data represents approximately 5% of total interstate carrier authorities, i.e., the carriers that change their operating status monthly, leaving the remaining 95% unchanged on an ongoing basis.
Get the clearest, most accurate view of the truckload marketplace with data from DAT iQ.
Tune into DAT iQ Live, live on YouTube or LinkedIn, 10am ET every Tuesday.
What’s not immediately apparent in the data is which sector is losing capacity and which is gaining and why. Speaking to carriers and brokers, anecdotal evidence points to long-haul capacity in the more volatile “freight” sector declining rapidly while shorter-haul regional capacity is declining less and may even be increasing as new carriers seek more stable volumes and rates. Capacity is clearly migrating to where the freight is, a trend Zac Rogers from Colorado State University told DAT Freight & Analytics on a recent DAT iQ show, “and is being added in a smart and targeted way to where demand is. This includes final-mile delivery or delivery between distribution centers and retail stores.”
The Journal of Commerce reports large truckload carrier capacity at the end of the third quarter, as measured by the number of trucks on the road in publicly listed companies, was at the same level as the second quarter of 2020 when the pandemic crashed demand. Truckload capacity continues to exit the market, but certainly not as fast as many expected. Nonetheless, at some stage, we will get to a market equilibrium where the number of available trucks on the road matches the volume of loads on offer. The big question is when, and while seasonality is emerging this holiday season, our expectation is the Spring of 2024 will be when we’ll know the answer.
Market watch
All rates cited below exclude fuel surcharges unless otherwise noted.
State average outbound rates in Texas, at $1.49/mile, are just $0.06/mile higher than in 2019 and $0.14/mile higher than in 2022. In Houston, dry van rates increased for the fourth week following last week’s $0.03/mile gain, averaging $1.44/mile. In contrast, loads from Houston to Dallas were the lowest in 12 months at $1.90/mile last week, while regional loads east to Shreveport paid carriers an average of $2.72/mile.
In Elizabeth, NJ, spot rates increased for the fourth week, averaging $1.31/mile following last week’s $0.02/mile gain. Elizabeth to Columbus, OH, paid carriers $1.31/mile, almost identical to this time in 2019 but only about one-third of what spot rates were at their peak of $3.21/mile in February 2022.
In Los Angeles, available capacity tightened last week, driving up spot rates by $0.07/mile to an average outbound rate of $1.83/mile. Regional loads paid carriers $2.88/mile on the busy Phoenix lane, where rates have been for the last six months. While $2.88/mile is good, it is almost $2.00/mile lower than the peak in December 2021 when imports surged into Los Angeles.
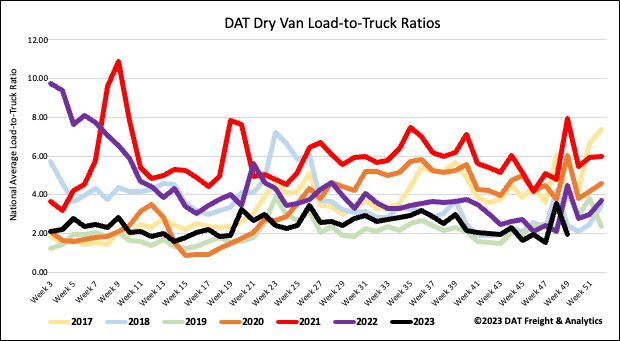
Load-to-Truck Ratio (LTR)
Following the post-Thanksgiving spike in load post (LP) volume, the market followed seasonal patterns, dropping back to normal last week, around 65% lower than last year. Carrier equipment posts increased by 5% week-over-week (w/w) as capacity loosened slightly, resulting in last week’s dry van load-to-truck ratio (LTR) dropping to 1.94.
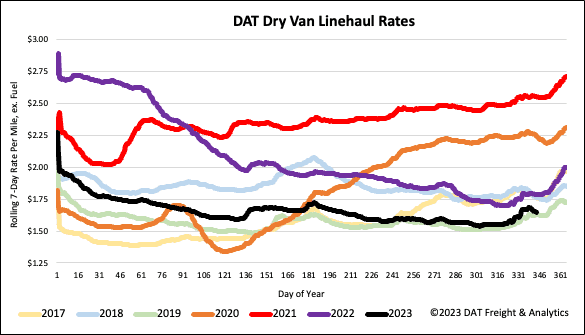
Linehaul spot rates
Dry van linehaul rates followed season patterns, decreasing by $0.01/mile last week. At $1.66/mile, dry van spot rates are $0.14/mile lower than last year and within $0.01/mile of this time in 2019. DAT’s Top 50 lanes, based on the volume of loads moved, averaged $1.96/mile last week, maintaining the $0.30/mile spread.