Data analysis for the week ending Saturday, April 18th, 2026 Week 16. All rates cited below exclude fuel surcharges, and load volume refers to loads moved unless otherwise noted. The rate charts exclude 2021 and 2022 years influenced by the pandemic.
The February for-hire trucking ton-mile index posted a headline that sounds almost irrelevant: seasonally adjusted demand up just 0.1% year-on-year, down 0.3% from January, with a six-month average YoY change of 0.2%. On aggregate, there’s no demand recovery to speak of. But the aggregate is masking a split that explains exactly what’s happening in truckload markets right now.
Get the clearest, most accurate view of the truckload marketplace with data from DAT iQ.
Tune into DAT iQ Live, live on YouTube or LinkedIn, 10am ET every Tuesday.
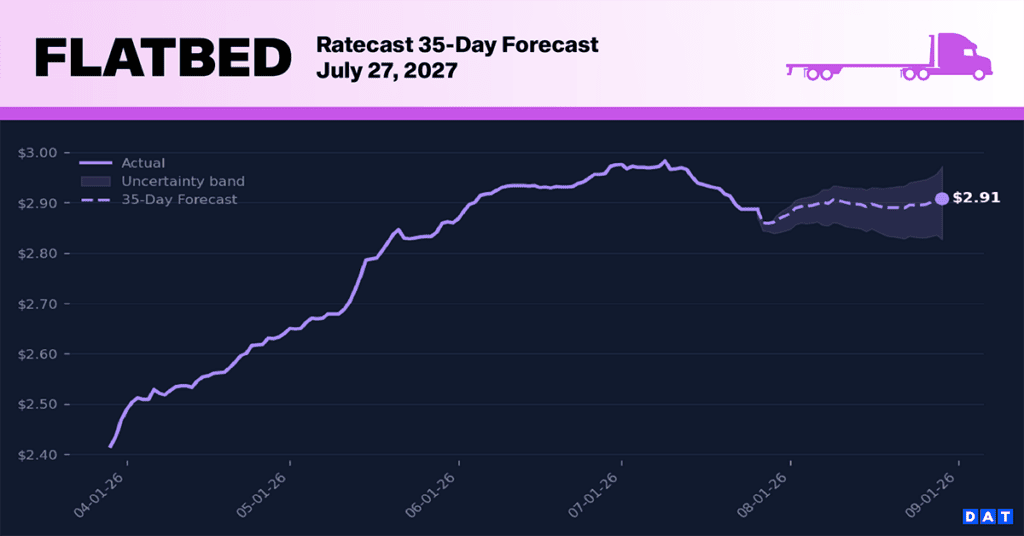
Dig into the subsectors and you find two freight economies running in parallel. Sectors tied to the AI infrastructure build-out — construction steel, structural metal fabrication, electrical switchgear, batteries, construction machinery — are posting meaningful year-over-year gains. Meanwhile, sectors tied to single-family housing and consumer spending — wood products, furniture, appliances, paper — are tracking lower. That divergence isn’t incidental. It’s why flatbed has been running significantly tighter than dry van in 2026: the growing sectors generate open-deck freight; the contracting sectors fill dry vans.
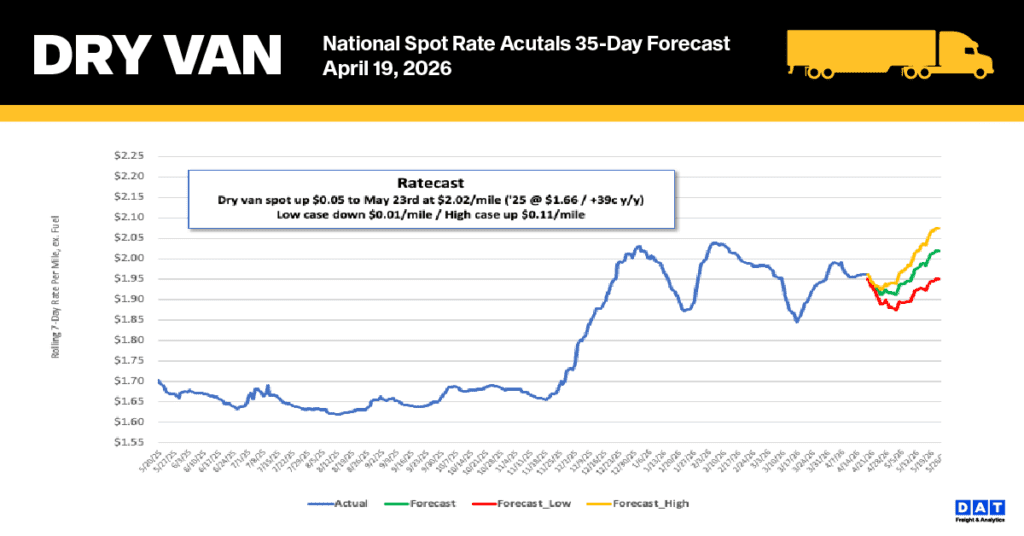
The recent rate recovery stems from a shrinking carrier base (capacity attrition) rather than increased demand. With overall freight volume flat, fewer carriers have tightened the market. This dynamic is reflected in DAT spot rates, which are up 25-30% year-over-year. In essence, supply is driving the market tightness that demand is currently lacking.
The key question now is the path forward. For shippers, the “flat demand” picture is misleading because market conditions vary significantly by freight mix. The freight market is showing a distinct split: commercial construction and infrastructure-related freight, particularly flatbed, is strong, while consumer-driven freight remains soft. This disparity necessitates a shift in procurement strategy from a broad-market reaction to a more targeted approach based on specific lanes and commodities.
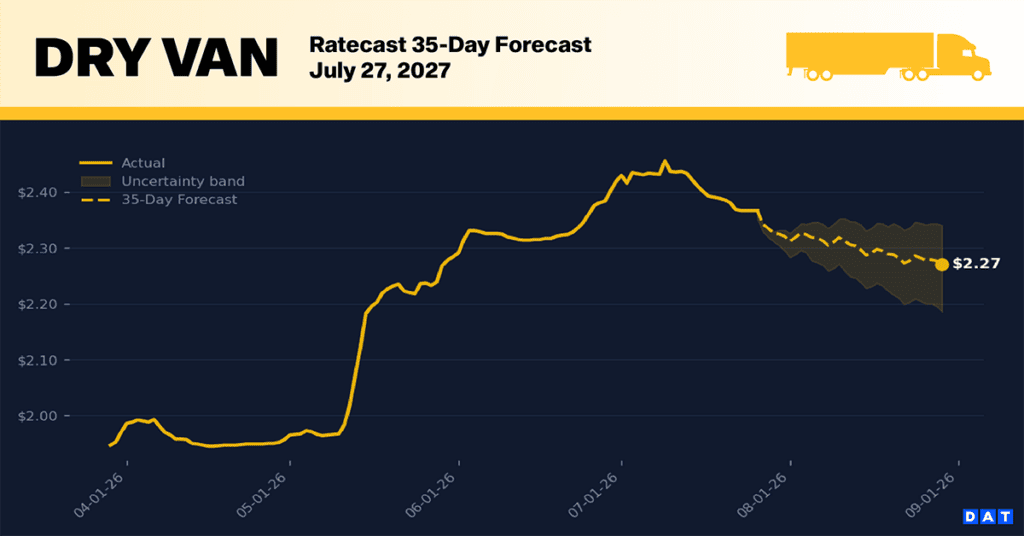
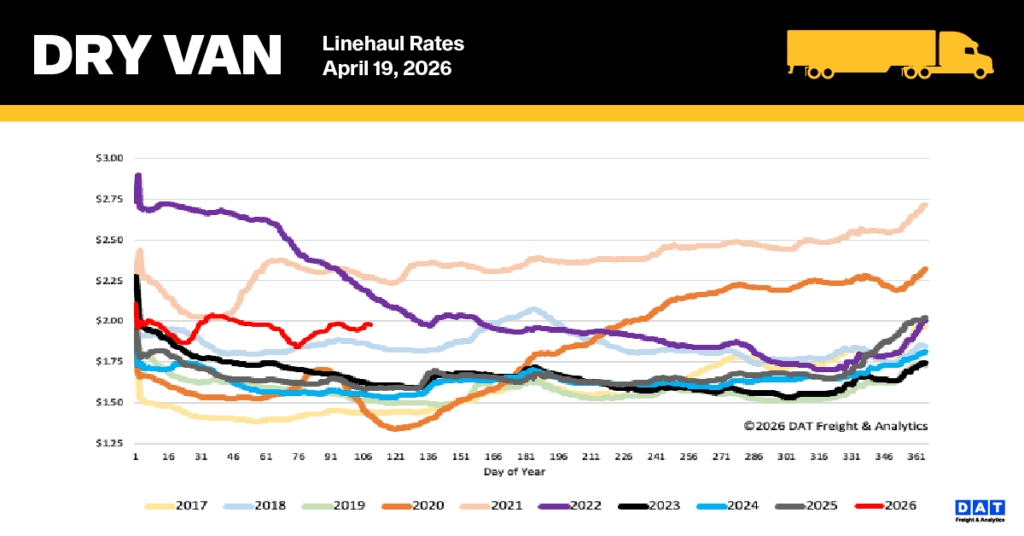
National dry van linehaul spot rates
The national 7-day average dry van linehaul spot rate (excluding fuel) dropped by $0.02 per mile last week, settling just below $1.99 per mile. This decline of $0.05 per mile follows an earlier increase of $0.07 per mile in late March, when spot rates had risen to match soaring diesel prices. The recent decrease aligns with two factors: easing tensions in the Middle East and a $0.25 per gallon drop in over-the-road diesel, which finished the week at $5.56 per gallon.
The current linehaul rate is $1.99, an amount significantly higher than historical averages. This rate marks a notable increase: it is $0.40 (a 25% rise) above the rate from a year ago. Moreover, at $0.44 (22%) higher, it surpasses the five-year average when excluding the years affected by the pandemic.
Last week, spot rates on DAT’s top 50 lanes, based on load volume, experienced a decrease of $0.03 per mile, settling the average at $2.36 per mile. This figure is $0.37 higher than the national 7-day rolling spot rate.
The 13 key Midwest states, which serve as a national bellwether and account for nearly half of the country’s load volume, saw their average rate decline by $0.05 per mile, settling at $2.32 per mile. Despite this drop, the Midwest average remains strong, currently outpacing the national 7-day rolling average by $0.33, a consistent pattern observed in the performance of top lanes.
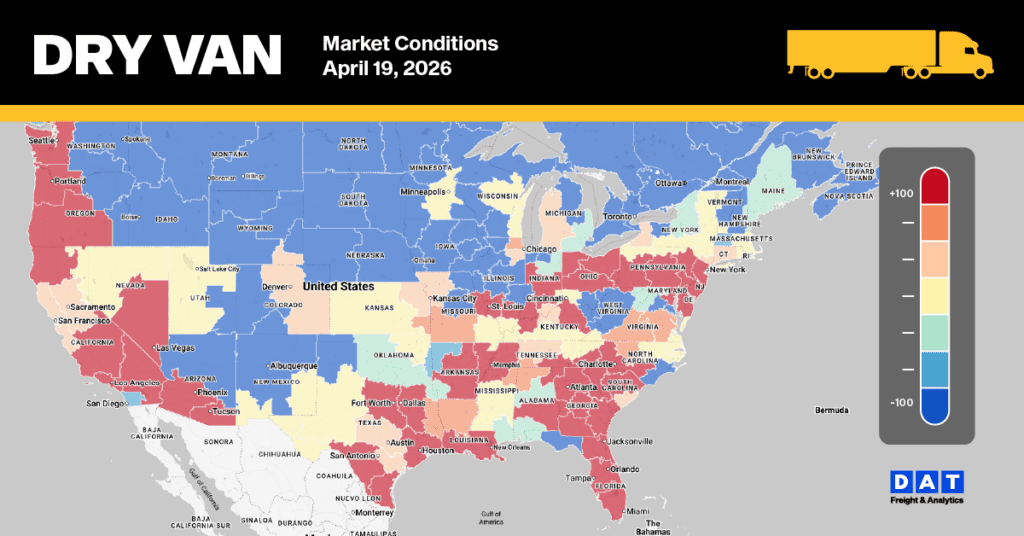
Dry Van Market Conditions
Despite robust load post volumes, which were 7% lower than the previous week but still 60% higher than last year and double the long-term average for Week 16, the national dry van load-to-truck ratio fell 3% last week to 7.43. This decline indicates a continued tightening of truckload capacity, supported by a 4% decrease in equipment posts.