The May 2022 reading of the for-hire trucking ton-mile seasonally adjusted index produced by Yemisi Bolumole and Jason Miller at Michigan State University (MSU) saw a 1.4% increase over April and a 5.0% increase over May 2021. May 2022 is also 1.6% above May 2018, which held the prior record for trucking activity in May. The ton-mileage index is derived from the physical quantity output for 41 different industry sectors that generate freight. Regarding subcomponents, freight-weighted mining and manufacturing data is practically equal to 2018 levels (down due to the lower auto sector). In contrast, wholesale, retail, and warehousing activity lift ton-miles above 2018 levels.
According to Jason Miller, “we didn’t see a freight recession for trucking occur in the second quarter. TTMI is the most all-encompassing measure of trucking activity and outperforms all other indexes in correlation with Census Bureau’s revenue data for trucking. The year-over-year ton-mile gains align well with the year-over-year tonnage gains reported by Old Dominion, ArcBest, and Saia, so these estimates seem reasonable.”
The Transportation Services Index (TSI) measures the month-to-month changes in the output of services provided by the for-hire transportation industries. Changes in the TSI reflect changes in the demand for goods and services. The Freight Transportation Services Index (TSI) rose 0.3% in May from April after a one-month decline, according to the U.S. Department of Transportation’s Bureau of Transportation Statistics’ (BTS). In addition, from May 2021 to May 2022, the index rose 2.6% compared to a decline of 2.0% from May 2019 to May 2021. The Freight TSI increased in May from April due to seasonally adjusted increases in trucking, rail carloads, and rail intermodal, while air freight, water, and pipeline declined.
All rates cited below exclude fuel surcharges unless otherwise noted.
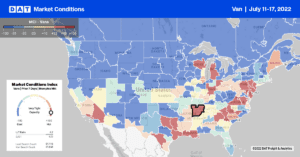
The Port Authority of New York and New Jersey (PANYNJ) took the number one spot from the Port of Los Angeles for the highest volume of containerized imports in June. Following June’s 15% m/m increase, import volumes are now up 24% y/y, driving higher spot market activity for the fifth week. Load posts in the Elizabeth, NJ, freight market are up 32% in the last month after increasing 14% last week, resulting in capacity tightening over the same time frame. Linehaul spot rates in Elizabeth increased $0.01/mile to an average outbound rate of $1.73/mile last week, which is up $0.08/mile in the previous month.
Loads to Boston, 233 miles to the northeast, increased by $26/load to an average of $1,069/load last week, making it the first time linehaul rates had increased on this lane since February when they were $338/load higher. Spot rates have been heading in the opposite direction for loads to Atlanta after dropping slightly below the June average last week at $1.48/mile. Capacity on the Elizabeth to Houston lane tightened last week – spot rates are now $0.05/mile higher than the June average at $1.14/mile and $0.34/mile lower than last year.
On the West Coast in California, Stockton and San Francisco markets were the only two to report gains last week. Combined outbound spot rates were up $0.02/mile to an average of $2.09/mile, while rates dropped $0.04/mile in the other four markets (Los Angeles, Fresno, Ontario, and San Diego), where linehaul rates averaged $2.26/mile last week.
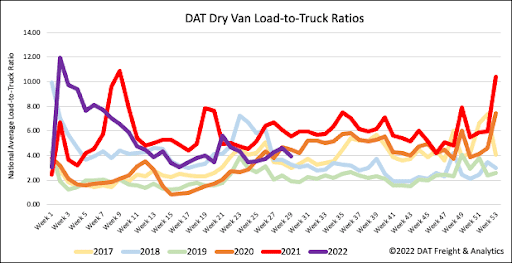
Dry van load posts bounced back last week, increasing by 12% w/w, while equipment posts jumped by 31% to the highest level recorded in mid-July. At just over 1.1m load posts, volumes are 21% lower than the previous year but 51% higher than in 2018. The net effect on last week’s dry van load-to-truck ratio was a slight decrease to 3.94.
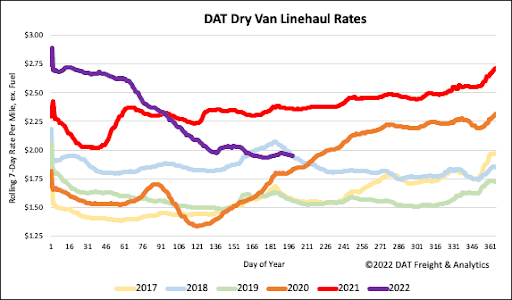
Dry van linehaul rates decreased by less than a penny-per-mile last week to a national average of $1.97/mile. Reefer spot rates are $0.41/mile lower than the previous year but are still $0.28/mile higher than the average of pre-pandemic years but exactly where they were in 2018. Compared to DAT’s Top 50 lanes measured by loads moved, which averaged $2.39/mile last week, national average linehaul spot rates are $0.42/mile lower.


