According to the latest data from PIERS, imports for July are up 0.8% month over month and 2.1% year over year, and YTD import volume is up 4.9% y/y. The ports of Charleston (+14%), Houston (+13%), Savannah (+7%), and Los Angeles (+7%) had the highest m/m volume increases for July. Highlighting the coastal shifts of imports from the west coast, July imports to the gulf coast are up 24.2% y/y, and imports to the east coast are up 8.3% y/y, while the West coast volume is down 7.0% y/y. Imports to the east coast are nearly the same as the west coast, with approximately 45% of YTD volume going to these coasts. Comparing this to last year’s January-to-July import volume, 48% went to the west coast while 43% went to the east coast.
Savannah is the fourth largest port in import volume, and an article by the JOC highlights that to handle the increased volume, the Georgia Ports Authority is extending its truck hours to help with the higher volumes. Truck gates will run from 4:00 am to 9:00 pm during the week for 17 hours daily. The previous schedule was 16 hours per weekday — an early shift from 6:00 am to 6:00 pm and an evening shift from 7:00 pm to 11:00 pm. GPA CEO Griff Lynch said the revised hours reflect drivers’ preference to start work earlier in the morning and will increase the number of trucks visiting daily.
“No one thought we would have the kind of volumes that we have today, and the GPA is doing everything we can, but it takes time to make the adjustments,” Lynch said. “Our July numbers should show double-digit growth. We should have some growth in August as well. I don’t see anything dipping down in terms of volume for the next five to six weeks.” The port has also increased storage capacity in the Garden City Terminal by about 25 percent. Lynch expects an eventual slowdown in imports, but he doesn’t anticipate the volume decline until the fourth quarter.
To reduce congestion, the Port Authority of New York and New Jersey have announced a per-container fee for export boxes that dwell too long at the port to free up space. PANYNJ said its quarterly “container imbalance fee” will go into effect on Sept. 1, following a 30-day public review period. The $100-per-container fee will be applied if ocean carriers don’t remove at least 10 percent more containers than they dropped off during the quarter. The PANYNJ said the fees will offset the costs of providing additional storage capacity and other handle expenses due to “the glut of empty containers.”
All rates cited below exclude fuel surcharges unless otherwise noted.
Following July’s surge in imports and vessel congestion offshore, dry van spot rates from Savannah to Atlanta hit a 12-month high last week at $993/load, which is $13/load higher than the previous year. In contrast, spot rates to other major destinations, including Dallas and Miami, decreased by around $0.25/mile since the end of July to $1.27/mile and $2.84/mile, respectively. From the number two port in the country in Elizabeth, NJ, spot rates to Atlanta have been steady at around $1.63/mile for the last ten weeks and $0.37/mile lower than the previous year.
Dry van loads from Chicago to Atlanta are up slightly to $2.18/mile this week but still around $0.70/mile lower than August last year. On the West Coast in Los Angeles, loads to Chicago are up approximately $0.10/mile over the July average to $1.84/mile this week – they were almost $1.00/mile higher this time last year. Decreasing imports into Los Angeles has translated into fewer spot loads to the nearby warehouse market in Phoenix, where spot rates are at their lowest in 12 months at $3.28/mile this week. That’s also almost $1.00/mile lower than the previous year and just over $1.50/mile lower than last year’s high of $4.81/mile recorded in November.
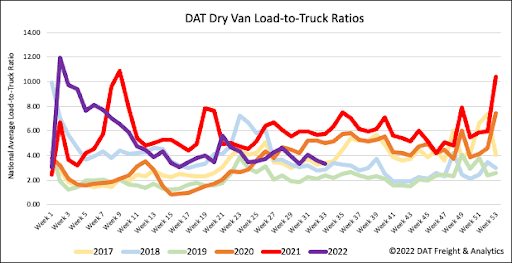
Load posts have decreased for the last three weeks following last week’s 6% w/w decline. Volumes are 37% lower y/y but still 21% higher than in 2018. Carrier equipment posts decreased 3% w/w and are now 8% higher than the over-supplied 2019 freight market. As a result of lower load posts and higher equipment posts last week, the dry van load-to-truck (LTR) decreased to 3.30, or almost the same as 2017 LTR levels.
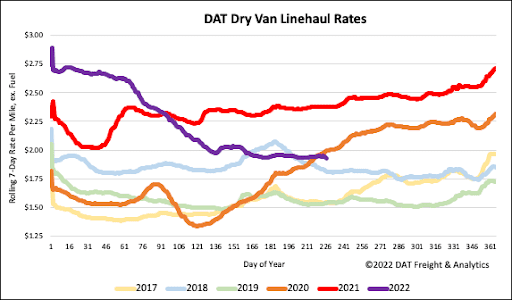
After remaining relatively flat for the prior month, the national average dry van linehaul rate dropped $0.02/mile last week to $1.95/mile. Compared to the top 50 lanes at $2.39/mile this week, the national average was $0.44/mile lower last week. Dry van linehaul rates are also $0.45/mile lower than the previous year but still $0.35/mile higher than the average of pre-pandemic years.


