For the second straight month, U.S. manufacturing is expanding, and the February ISM Manufacturing PMI of 52.4 carries some meaningful signals for truckload carriers and brokers watching for demand inflection points in 2026. New Orders came in at 55.8 percent, marking the second consecutive month of expansion after four straight months of contraction, which is the leading indicator freight markets care most about — new orders today become shipments tomorrow. The Backlog of Orders Index surged to 56.6 percent, its highest reading since May 2022, signaling that production pipelines are filling back up. Equally important for future freight volumes, the Customers’ Inventories Index remained near its lowest level since June 2022 at 38.8 percent, meaning manufacturers still see their customers as underinvested in stock — a condition that historically drives restocking freight activity.
Get the clearest, most accurate view of the truckload marketplace with data from DAT iQ.
Tune into DAT iQ Live, live on YouTube or LinkedIn, 10am ET every Tuesday.
Tariffs are the dominant theme in the commentary, with respondents across transportation equipment, machinery, and computer products all flagging that steel, aluminum, and imported goods costs are rising sharply, with one manufacturer noting that Section 232 tariff policy is “raising prices while lowering demand and profitability.” Companies are actively working to broaden their supplier bases, shift to domestic sourcing, and push costs back through the supply chain — while simultaneously trying to protect margins through cost discipline and headcount management. The overarching mood is cautiously optimistic but operationally stressed, with businesses investing in growth on one hand and fighting cost fires on the other.
National dry van linehaul spot rates
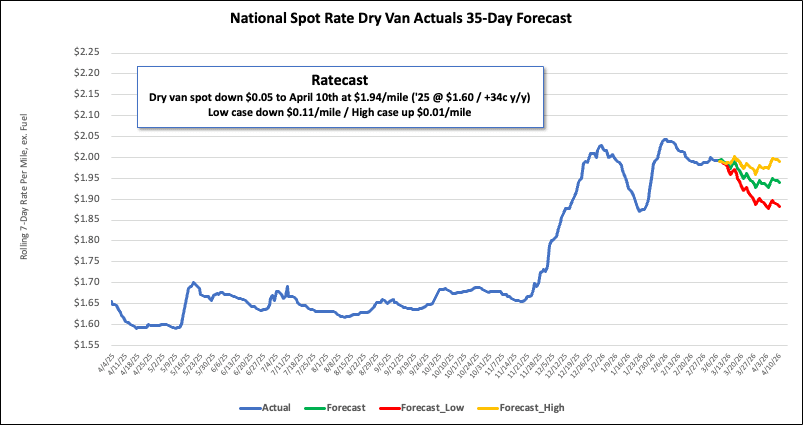
The dry van market continues to see capacity loosen, as the national 7-day average linehaul spot rate (excluding fuel) dipped just below $2.00 per mile by the end of the week. This marks the fourth consecutive weekly decrease of $0.02 per mile, resulting in a total $0.08 loss in dry van linehaul rates during February. These recent decreases have erased nearly half of the rate gains seen after Winter Storms Fern and Gianna.
Even with this recent decline, the rate is still elevated. It is currently $0.36 (22%) above the rate recorded a year ago and, when excluding the pandemic-affected years, it remains $0.41 (20%) higher than the five-year average.
The average rate for DAT’s top 50 lanes by load volume also decreased by another penny per mile last week, averaging $2.24 per mile and $0.24 higher than the national 7-day rolling average spot rate.
In the 13 key Midwest states, which represent around 47% of national load volume and often indicate future national trends, spot rates decreased by $0.01 per mile to $2.44 per mile, which was $0.44 above the national 7-day rolling average.
Dry Van Market Conditions
Despite a surge in the previous week due to end-of-month shipments, dry van load post volumes saw an 8% decrease last week to start March. However, these volumes remain strong, standing 53% higher than the same period last year and nearly double the 10-year average (excluding the pandemic years of 2021 and 2022). Concurrently, equipment posts also dropped by 6%. As a result of these shifts, the national load-to-truck ratio slightly decreased, settling at 8.10 last week.