There is no market recovery coming in 2023, and the best-case scenario is for improvement in Q2 2024, according to Prof. Jason Miller of Michigan State University in the release of the latest Trucking Ton-Mile Index (TTMI). The index is calculated as a weighted geometric mean of physical output, or inflation-adjusted sales, or total labor hours for 41 freight-generating sectors of the economy as identified by the Census Bureau and Bureau of Transportation Statistics in the Commodity Flow Survey. For truckload carriers, the TTMI has proven to be the most reliable indicator of freight demand, which points towards a prolonged period of weak truck transportation demand.
The July TTMI was 0.6% lower than in June and 2.3% lower than in July 2022. Miller said, “The month-over-month decrease in seasonally adjusted ton-miles was primarily driven by weak demand in several freight-centric wholesale trade sectors such as miscellaneous durable goods (NAICS 4239) and farm products (NAICS 4245). The year-over-year decline is more broad-based and driven primarily by decreased manufacturing output.” A muted peak import season and lower production in freight-centric sectors, including the manufacturing of paper, wood, plastic, and rubber products, suggest a freight recovery in 2023 is improbable.
Get the clearest, most accurate view of the truckload marketplace with data from DAT iQ.
All rates cited below exclude fuel surcharges unless otherwise noted.
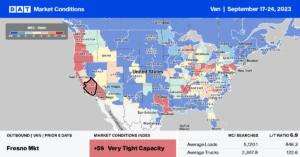
After dropping $0.07/mile over the prior three weeks, dry van outbound capacity tightened slightly in Phoenix, the Southwest’s largest warehouse market, with spot rates increasing by $0.01/mile to $1.37/mile. Phoenix to Denver loads paid carriers $1.76/mile, $0.39/mile lower than the August average and $0.50/mile lower y/y. Arizona state-level average rates, at $1.23/mile, are around $0.03/mile lower than in 2019.
In Los Angeles, spot rates increased by $0.01/mile to an average outbound rate of $1.72/mile, while next door in Ontario, spot rates dropped for the third week to an average of $1.80/mile. In the large Midwest markets of Joliet and Chicago, the prior three weeks’ gains were erased last week following a $0.05/mile decrease to an average of $2.04/mile. Outbound rates dropped $0.03/mile in Elizabeth, NJ, to an average of $1.46/mile. In the spot market’s top five freight-producing states, rates averaged $1.72/mile last week, identical to 2019.
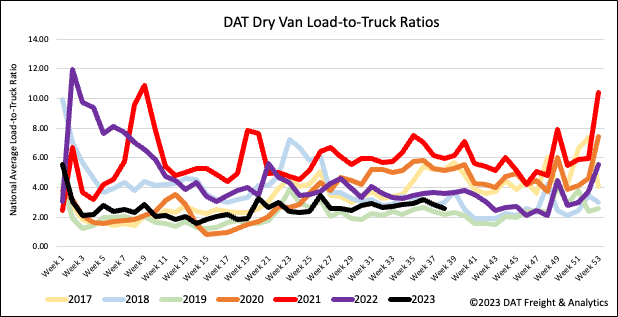
Dry vanspot market load posts (LP) lost the prior week’s gain following last week’s 11% week-over-week (w/w) decline. Load posts are 40% lower than last year and just 25% below 2019 levels. Carrier equipment posts were flat, resulting in last week’s dry van load-to-truck ratio (LTR) decreasing from 2.95 to 2.56.
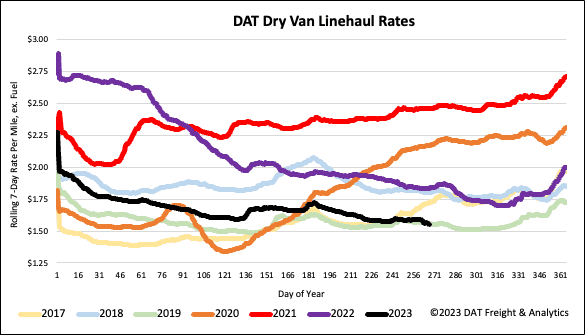
At just over $1.57/mile, dry van linehaul spot rates are 15% (or $0.28/mile) lower than last year, following last week’s $0.03/mile decrease. Last week’s national average was identical to 2019. Compared to DAT’s Top 50 lanes based on the volume of loads moved, which averaged $1.88/mile last week, the national average is around $0.31/mile lower.


