The latest IHS Markit/PIERS import data for November reports a 9% month-over-month (m/m) volume decline. Notably, West Coast volumes are returning at the expense of the East and Gulf coasts, which were the recipients of a shift in volumes away from the West Coast throughout 2021 and into 2022. Led by an 18% m/m decline in New York, the third-largest port for imported containerized volume (15% of total volume), East Coast volumes dropped 12% m/m in November.
On the West Coast, where around one-third of containerized imports are processed, import volumes in November were up 5% m/m at the Port of Los Angeles and down 9% m/m at the Port of Long Beach. The Gulf Coast is increasingly impacted by the ongoing drought in the Panama Canal, and imports plunged by 24% m/m. Houston is the largest port in the region; it reported 15% lower import volumes in November.
National volumes totaled 2,131,187 twenty-foot equivalent units (TEU) in November, around 6% higher than in 2022 and 5% higher than the November monthly average over the eight years prior.
Find van loads and trucks on North America’s largest on-demand freight network.
All rates cited below exclude fuel surcharges unless otherwise noted.
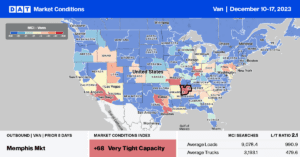
After dropping out of the top 10 spot markets earlier in the year, the Los Angeles and Ontario, CA, markets have reentered the top two spots, capturing a 6% market share last week. Truckload capacity is very tight overall, and on the highest volume lane north to the warehouse market in Stockton from Los Angeles, spot rates continue to rise, averaging $2.61/mile last week. That’s the highest since August and around $0.03/mile higher than in 2022.
Outbound capacity loosened in Fort Worth, TX, last week. It was impacted by fewer trucks moving between Houston and Fort Worth, the top dry van lane in the state. Loads moving in both directions have dropped by just over 18% since October, around the same time the Panama Canal Authority reduced the number of daily transits from 29 to 25 ships. Under normal conditions, between 34 and 36 vessels traverse the canal daily. The reduced daily transits represent a 30% drop in ocean capacity. Since Houston’s peak in import volume in August 2022, linehaul rates north to Fort Worth, a significant warehouse distribution market, have dropped close to $0.40/mile in both directions.
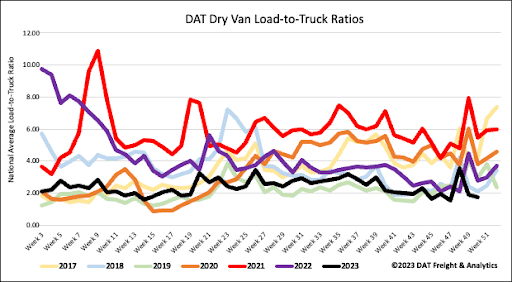
High levels of routing guide compliance in the contract freight market are resulting in fewer loads entering the spot market compared to prior years – even in 2019, a notoriously poor year in the freight market. Load posts (LP) have decreased by 18% in the last month, while carrier equipment posts are tracking identically to pre-pandemic years. Last week’s dry van load-to-truck ratio dropped by 6% week-over-week to 1.76.
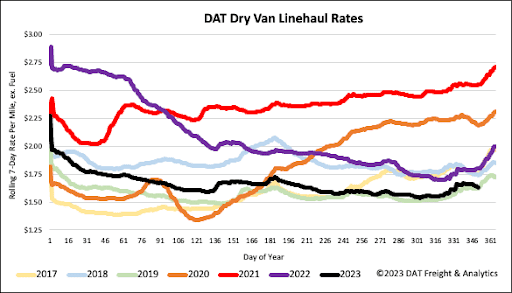
Dry van linehaul rates continue to follow season patterns, decreasing by another $0.01/mile last week. At $1.65/mile, dry van spot rates are $0.17/mile lower than last year and almost identical to 2019. Compared to the prior two recessionary freight periods in 2016 and 2019, linehaul rates increased by $0.10 from this point to the end of the year. This year’s spot market is tracking the closest to 2019; both were mostly flat to down slightly in the three weeks after Thanksgiving before starting the year-end climb as capacity tightens.


