We celebrate Halloween this week, and there are signs dry van carriers have benefited somewhat through higher spot market volumes. Of course, these loads were already positioned in freight markets before this week’s big event. According to the National Retail Federation (NRF), total Halloween spending is expected to reach a record $12.2 billion. That exceeds last year’s record of $10.6 billion.
Expect to see adults dressed in witch costumes, children dressed up as Spider-Man, and pets looking more like pumpkins this week. The NRF survey found the top ways consumers are planning to celebrate Halloween are: handing out candy (68%); decorating their home or yard (53%); or dressing in costume (50%). Spending on costumes is expected to top $4.1 billion, up from $3.6 billion last year, including a record-high $2 billion spent on adult costumes, up 18% from $1.7 billion in 2022.
“More Americans than ever will be reaching into their wallets and spending a record amount of money to celebrate Halloween this year,” NRF President and CEO Matthew Shay said. “Consumers have been shopping early for festive décor and other related items, and retailers had the inventory to help customers and their families participate in this popular and fun tradition.”
Market Watch
All rates cited below exclude fuel surcharges unless otherwise noted.
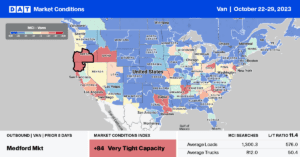
Except for California, the nation’s top five spot markets (California, Illinois, Georgia, New Jersey, and Texas) all reported a decrease in average outbound spot rates last week in the $0.01 to $0.02/mile range. In California, outbound average rates increased by $0.01/mile to a state average of $1.99/mile. Based on rate trends in pre-pandemic years, California outbound rates have the potential to increase by another $0.10/mile before year-end. On the high-volume Los Angeles to Phoenix lane, spot rates at $3.08/mile were the highest in 12 months and $0.23/mile higher than the September average.
In Texas, outbound spot rates continued to cool, decreasing by $0.01/mile to a state average of $1.39/mile, $0.05/mile higher than in 2019 and $0.23/mile lower than last year. Compared to the most recent high in late 2021, last week’s average was just over $1.00/mile lower. Outbound rates in Illinois followed a similar cooling trend, averaging $2.04/mile, down $0.01/mile week-over-week (w/w). At $1.40/mile, outbound New Jersey spot rates are just half what they were at the end of 2021 and just $0.05/mile higher than in 2019.
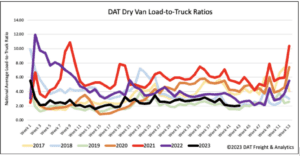
Load-to-Truck Ratio (LTR)
Dry van spot market load posts (LP) decreased 5% last week as we moved through the typical late October low point before seasonality starts to lift the market. LP volume remained 35% lower year-over-year (y/y). Carrier equipment posts were also down, resulting in last week’s dry van load-to-truck ratio (LTR) remaining primarily flat at 2.02.
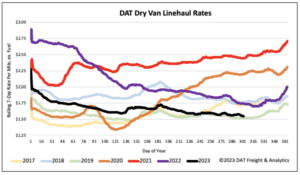
Linehaul Spot Rates
Following last week’s $0.01/mile decrease, dry van linehaul spot rates erased the prior week’s gains. At the end of October, the national average is $1.56/mile, $0.20/mile lower than last year and $0.03/mile higher than 2019. Compared to DAT’s Top 50 lanes based on the volume of loads moved, which averaged the same as the prior week at $1.86/mile last week, the national average is around $0.30/mile lower.