The American Trucking Association’s (ATA) advanced seasonally adjusted (SA) For-Hire Truck Tonnage Index increased 0.2% in August after rising 1.1% in July. In August, the index equaled 115.3 (2015 = 100) compared with 115 in July. ATA Chief Economist Bob Costello states, “The evidence is growing that tonnage hit bottom in April and continues its slow climb upwards. However, year-over-year comparisons remain difficult as tonnage peaked in September last year. As a result, it is unlikely that tonnage turns positive compared with a year earlier for at least a month or two longer. Most recently, freight continues to be mixed, with consumer spending and factory output flat to down.”
Compared with August 2022, the SA index fell 2.3%, the sixth straight year-over-year (y/y) decrease. ATA calculates the tonnage index based on surveys from its membership and has been doing so since the 1970s. This preliminary figure is subject to change in the final report issued around the 5th day of each month. The report includes month-to-month (m/m) and y/y results, relevant economic comparisons, and key financial indicators.
Get the clearest, most accurate view of the truckload marketplace with data from DAT iQ.
Tune into DAT iQ Live, live on YouTube or LinkedIn, 10am ET every Tuesday.
Market Watch
All rates cited below exclude fuel surcharges unless otherwise noted.
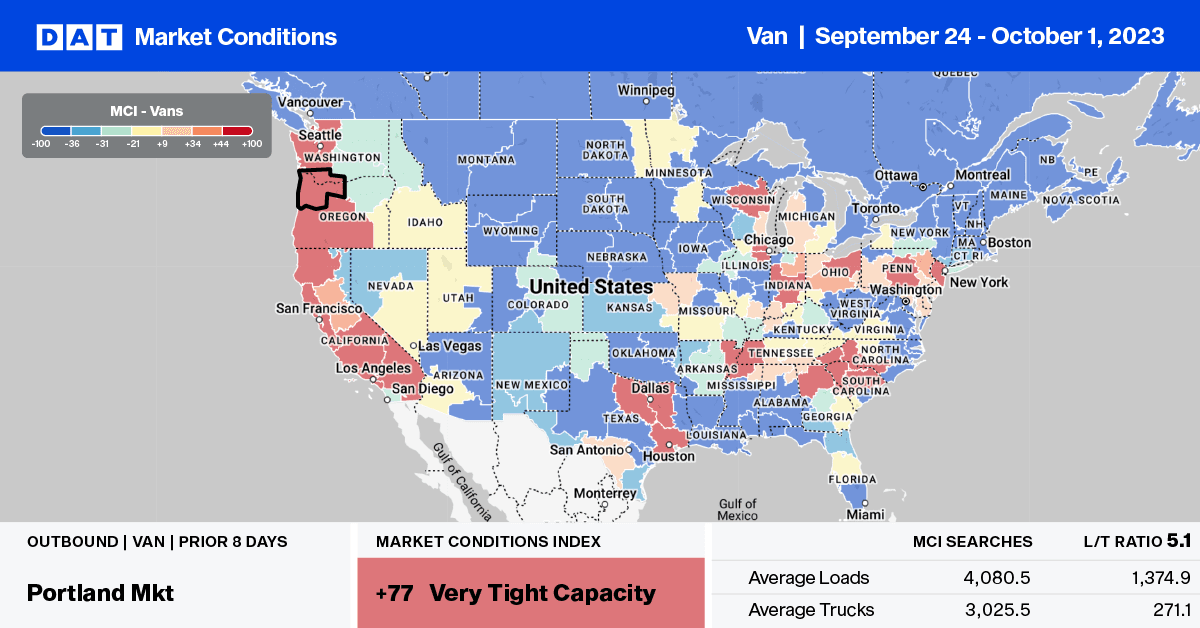
Outbound dry van capacity has been tightening in the Portland, OR, market following last week’s 33% week-over-week (w/w) surge in load posts, which have doubled in the last month. Linehaul rates have increased by $0.12/mile to an average of $1.23/mile over the same timeframe. Portland to Ontario, CA, loads paid carriers $0.71/mile, which was $0.07/mile higher than the August average. Phoenix loads paid almost $0.50/mile higher at $1.19/mile.
After dropping for the prior three weeks, spot rates for outbound loads in Ontario, CA, increased by $0.04/mile to $1.84/mile last week. Ontario load post volumes have almost doubled in the last month following last week’s 10% increase.
In the West Virginia freight market, spot rates edged over $2.00/mile last week, paying carriers $2.04/mile for outbound loads.
In the large distribution Georgia market, linehaul rates were mostly flat at $1.56/mile, which is $0.08/mile lower than in 2019. At $2.09/mile, Illinois state average linehaul rates were flat last week despite a 13% w/w increase in load posts. Illinois linehaul rates are currently only $0.05/mile higher than in 2019.
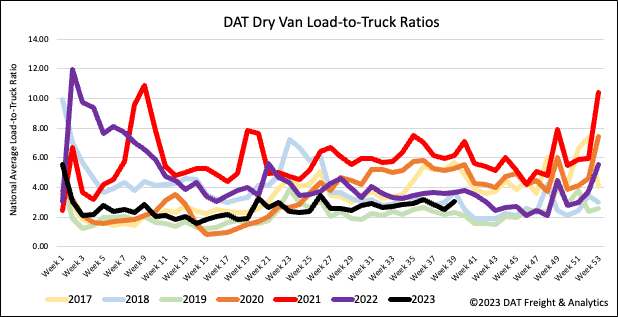
Load-to-Truck Ratio (LTR)
Dry van spot market load posts (LP) increased by 14% w/w as shippers cleared their docks with end-of-month and quarter freight. Load post volumes are still 31% lower than last year. Carrier equipment posts followed typical seasonal patterns, dropping by 7% w/w, resulting in last week’s dry van load-to-truck ratio (LTR) jumping by 22% to 3.07, only the fifth time the LTR has been over 3.0 this year.
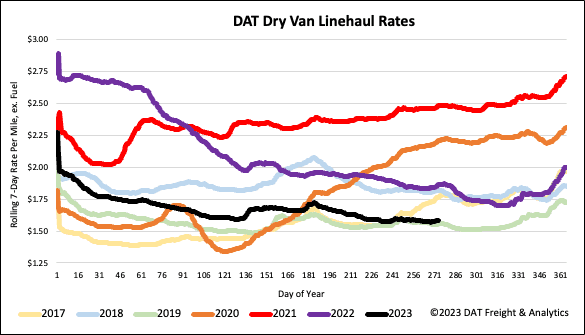
Linehaul Spot Rates
After dropping over the prior three weeks, dry van linehaul spot rates bounced back to where they had been over the prior two months. At $1.60/mile, linehaul rates were up just over $0.02/mile last week. That is still 15% – or $0.28/mile – lower than in 2022. Last week’s national average was only $0.02/mile higher than 2019. Compared to DAT’s Top 50 lanes based on the volume of loads moved, which averaged $1.88/mile last week, the national average is around $0.28/mile lower.