The war in the Middle East has quickly injected volatility into global energy markets, and diesel prices are responding faster than almost any other fuel. Military escalation involving Iran has pushed crude oil sharply higher as traders price in the risk of supply disruptions and potential closures of critical shipping lanes such as the Strait of Hormuz, through which roughly 20% of the world’s petroleum supply normally flows. That geopolitical “risk premium” flows directly into refined fuels used by the freight industry. In the United States, diesel prices recently climbed above $5 per gallon for the first time in nearly two years, with analysts warning prices could move even higher if the conflict intensifies.
Get the clearest, most accurate view of the truckload marketplace with data from DAT iQ.
Tune into DAT iQ Live, live on YouTube or LinkedIn, 10am ET every Tuesday.
For truckload carriers operating in the spot market, the impact is immediate and often brutal. Unlike contract freight, spot loads typically do not include fuel surcharges that adjust automatically when diesel spikes. That means every sudden jump in pump prices comes straight out of a carrier’s margin. Diesel futures and wholesale prices also tend to react faster than crude oil during geopolitical shocks, amplifying the squeeze on smaller fleets and owner-operators that rely on spot freight. When diesel jumps 75-90 cents in a matter of days—as has already happened in some markets during the current conflict—carriers running thin margins can see profitability vanish overnight.
Freight markets have an odd physics to them: fuel costs move like lightning, while spot rates move like molasses. Rates often take weeks to adjust to higher operating costs, especially in a soft freight environment where capacity still exceeds demand. For carriers hauling spot freight in 2026, the Middle East war is a reminder that geopolitical events thousands of miles away can ripple directly into the truck stop fuel pump—and into the weekly settlement sheet. The trucks may be rolling across America, but the economics powering them are tied tightly to global energy markets.
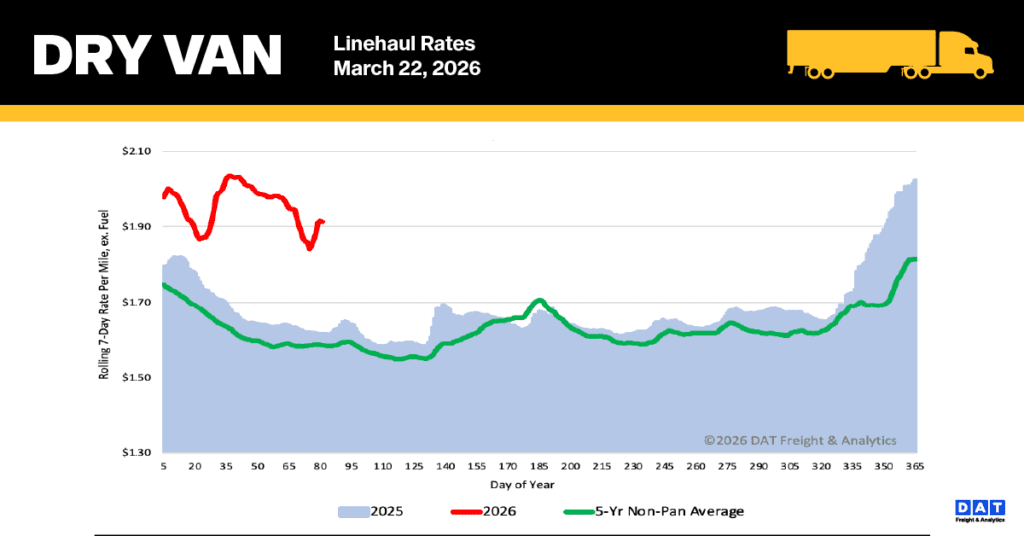
National dry van linehaul spot rates
Despite the almost $1.31 per gallon jump in over-the-road diesel since the Middle East War began three weeks ago, the national 7-day average linehaul spot rate (excluding fuel) for dry van trucks remained flat last week after dropping $0.08 per mile over the last two weeks. While rising fuel surcharges—up 44% from $0.44/mile to $0.64/mile in three weeks—are causing all-in spot rates to increase, carriers have been struggling to negotiate rate increases on a load-by-load basis that fully cover their higher costs at the pump.
The recent halt in the decline of linehaul rates suggests that carriers might be beginning to recover from a period where they struggled to fully incorporate the rising cost of diesel into their negotiated load rates. Until this past week, carriers were, on average, only managing to recapture less than 50% of the increased diesel cost when setting linehaul rates.
At $1.92 per mile, the rate is still elevated and is currently $0.30 (18%) above the rate recorded a year ago and, when excluding the pandemic-affected years, it remains $0.32 (17%) higher than the five-year average.
Spot rates saw a modest increase of one penny per mile last week on DAT’s top 50 lanes by load volume, reaching an average of $2.19 per mile. This average is $0.27 higher than the national 7-day rolling average spot rate.
In contrast, the 13 key Midwest states, which account for nearly half of the national load volume and are often seen as a bellwether for national trends, experienced a $0.05 per mile decrease in spot rates, settling at $2.26 per mile. Despite this drop, the Midwest average remains $0.34 above the national 7-day rolling average.
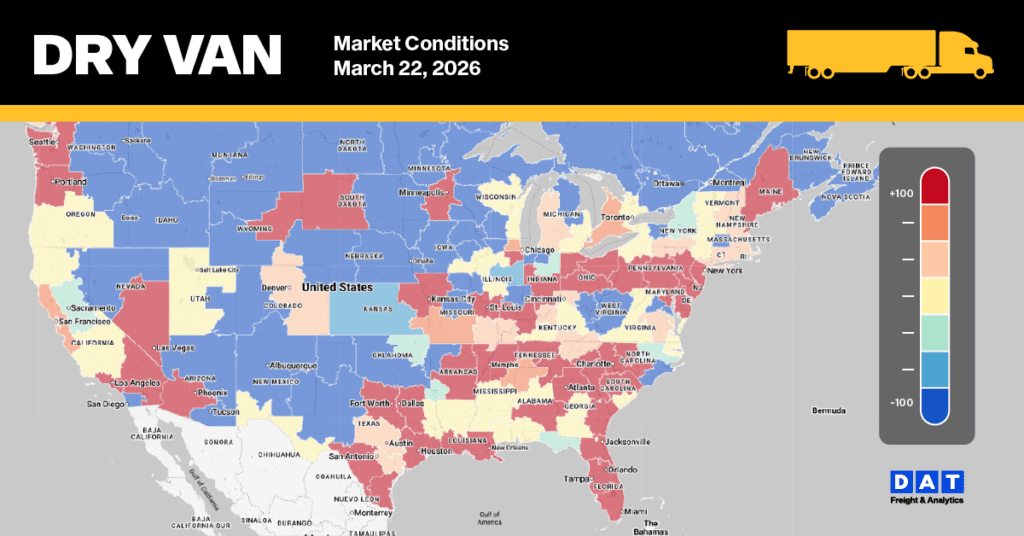
Dry Van Market Conditions
The national dry van load-to-truck ratio saw a significant increase last week, surging 34% to 10.4. This sharp rise was driven by a 17% increase in dry van load posts, which reversed a three-week decline, combined with a 13% drop in available equipment posts. Current load volumes are nearly double those of the same time last year and well above the 10-year average (excluding the pandemic years of 2021 and 2022).