By Christina Ellington
As fuel prices continue to rise with no apparent end in sight, oil companies can’t drill wells quickly enough to meet the growing demand. According to Baker Hughes, the national count shows a 61% y/y increase of weekly active drilling rigs as drilling companies react to recent supply and demand challenges. Oil rig drilling is also a driver of flatbed demand. Since 1940, the highest weekly U.S. rig count recorded was 4,530 in December 1981, and the lowest U.S. weekly rig count was more recently in August 2020 at 244 rigs. Weekly rig counts in 2021 remained at pretty low levels, with weekly active wells averaging about 524 a week; 2016 was the most comparable year for this level of active drills.
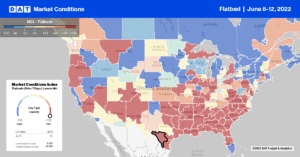
However, current drilling activity is on the rise. According to an interview with Ian Macpherson, Equity Research Analyst at Piper Sandler, active rigs have met the year-end projections of approximately 700 rigs weekly. Ian explains that the U.S. industry will grow to around 800 rigs a week by the end of the year or early next year. Unfortunately, supply issues will limit how much growth is possible. The latest data from Baker Hughes shows that there were 710 active drilling rigs for the week of 6/3/22. States with the highest y/y drilling rig increases are, Texas is up 141 rigs or 65% y/y; Oklahoma is up 31 rigs or 111% y/y; New Mexico is up 25 rigs or 34% y/y; North Dakota is up 19 rigs or 119% y/y.
All rates cited below exclude fuel surcharges unless otherwise noted.
Truckload capacity on the Houston to Lubbock lane loosened rapidly last week. Linehaul rates dropped to $3.07/mile after holding firm at around $3.72/mile for the previous eight weeks. The Houston outbound average rate dropped $0.07/mile to $3.00/mile, while loads north to Little Rock at $2.79/mile is up by $0.13/mile compared to the May average. After being tight for most of May, flatbed capacity in the San Diego market loosened last week, with spot rates dropping by $0.03/mile to $2.45/mile. A similar trend was reported for loads north to Stockton, where linehaul rates dropped to $1.80/mile, which is almost $0.80/mile lower than the previous year.
Flatbed capacity remained tight in the Las Vegas market, following a $0.40 jump in spot rates in the last two weeks to an average outbound rate of $3.04/mile. Loads west to Stockton were flat at $2.67/mile but had been trending down for the last 12-months and are now $0.75/mile lower than the same week the previous year. In Gary, IN, flatbed linehaul rates jumped by $0.70/mile above the May average last week to $3.97/mile on the 430-mile haul south to Pittsburgh. Capacity was also tight on the 730-mile haul northeast to Augusta, ME, where spot rates are up by $0.15/mile over May’s average to $3.25/mile.
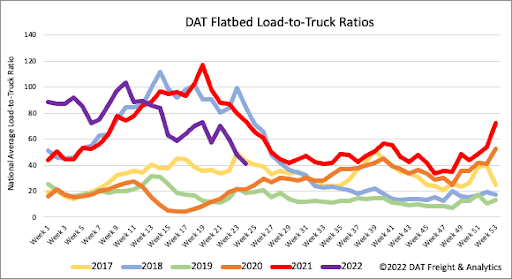
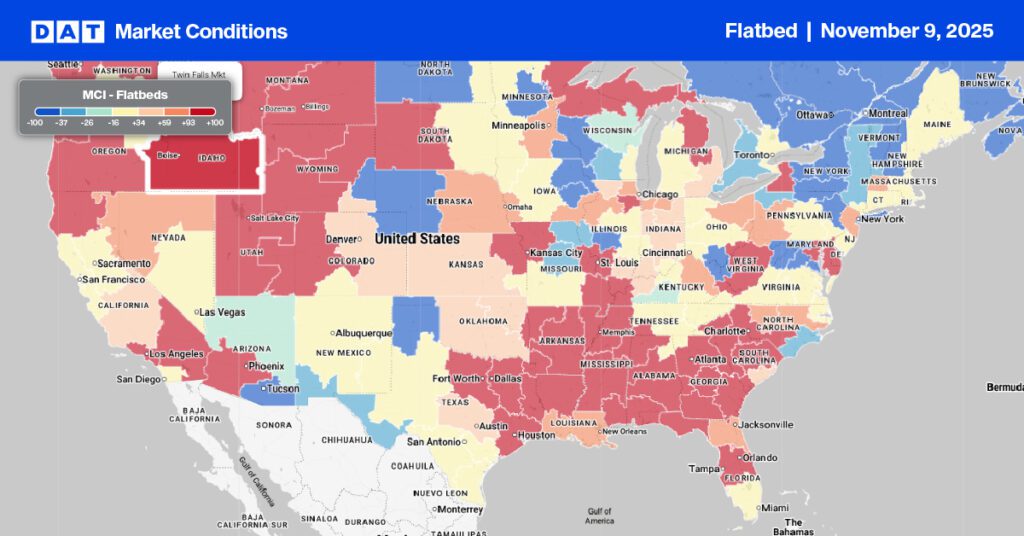
Load post volumes rebounded last week and are now just 10% lower than 2018 levels following an 11% w/w increase. With 30% more carriers posting their equipment on DATs loadboard last week, the flatbed load-to-truck (LTR) ratio dropped from 47.92 to 41.15, just 5% lower than in 2017.
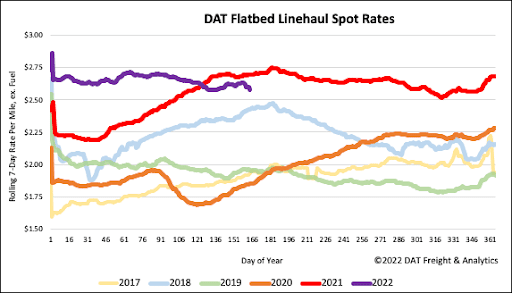
Following last week’s $0.03/mile decrease to a national average linehaul rate of $2.62/mile, flatbed spot rates are just $0.02/mile lower than the average of the previous 13-months. Flatbed spot rates are now $0.11/mile lower than the last year but still 6% or $0.15/mile higher than in 2018.