Houston is one of DAT’s top markets, recently boosted by the surge in imports impacting capacity for all equipment types – more volume means more options for carriers and brokers. Traditional West Coast shippers have increasingly shifted imports to Gulf Coast ports to avoid potential labor disruptions and port congestion in the Ports of Long Beach and Los Angeles. According to the latest September import data from IHS Market, containerized imports in Houston account for 9% of national volume and were flat sequentially but up 32% y/y. Nearby Mobile, Al (7% of volume), a much smaller port, saw imports up 1% m/m and 39% y/y. It’s no coincidence that the number of container ships waiting to unload continues to swell, numbering 28 off the coast of Houston and 16 off Mobile this week.
The broader picture shows shippers are still diverting a significant amount of imports away from Los Angeles and Long Beach, where total September import volumes were down 13% m/m. This is compared to the East Coast (down 6% m/m) and the Gulf Coast, which reported a 5% gain in import volume. Diving deeper into the Gulf Coast, September’s top two containerized import commodities compromised furniture (9%) and toys (6%), which increased in September by 7% and 55%, respectively. A spike in toy imports ahead of the retail shopping season is not surprising, but it underscores the coastal shift in imported commodity types that benefit all carriers. Toy imports nationally are down 13% m/m and 15% in Long Beach and Los Angeles combined, whereas, in Houston, they are up 48% m/m. Nationally, toy imports are up 5% y/y, but the west-to-east shift in imports is amplified at the coastal region level.
Northeast Asia (China, Japan, and Korea mainly) accounted for 92% of toy imports in September. Although the West Coast received the most containerized volume (47%), levels were down 20% y/y compared to the East Coast (up 27% y/y on 36% of volume) and Gulf Coast (up 110% y/y on 16% of volume). The majority of Gulf Coast volume was split between Houston (9%) and Mobile (7%), where import volumes increased by 84% and 159% y/y, respectively.
Market Watch
All rates cited below exclude fuel surcharges unless otherwise noted.
For flatbed carriers in the Southwest, where nearly 50% of drilling rigs are located, the Baker Hughes Rig Count provides a good insight into the demand for steel products, including drill pipe and casing. For the week ending October 14, 769 oil and gas rigs were in operation, representing a 42% increase y/y following last week’s 1% gain. In Texas, the rig count increased by five last week, 365, and in the West Texas Permian Basin, where 47% of new rigs are drilling, one new rig was reported making a total of 365 in total representing an increase of 46% y/y but a decrease of 25% compared to 2018 when regional drilling activity was at its peak. According to S&P Platts, steel production in Texas is also up by 10% compared to the previous year, although production volumes were flat last week.
The volume of flatbed loads moved between Houston, a significant source of oilfield products, to Lubbock in The Permian Basin has almost doubled in the last year while linehaul rates remain flat this week at just over $3.00/mile, which was the same as the previous year. At the state level, Texas outbound spot rates averaged $2.30/mile last week following last week’s 5% decrease, while in the state’s largest market in Houston, spot rates dropped by $0.14/mile to $2.44/mile. Flatbed capacity from Houston to Lakeland is still tight, with spot rates up $0.09/mile over the September average at $2.39/mile this week.
Further north in the Ft. Worth market, load posts jumped, increasing by 26% w/w, although brokers found plenty of outbound capacity, with spot rates dropping by $0.03/mile to $2.16/mile. In New England, capacity was very loose, with spot rates dropping by almost $0.25/mile for outbound loads even though there was a surge in load posts, which were up by nearly 50% last week. This region is predominantly inbound, so there’s always sufficient capacity to meet outbound demand – 60% more inbound loads arrive compared to outbound loads in the spot market.
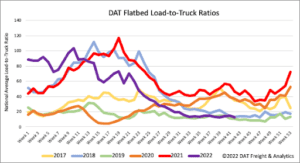
Load-to-Truck Ratio (LTR)
After jumping by 13% the week prior, national flatbed load posts fell back by almost the same amount last week. As we reported the prior week, inbound volumes following Hurricane Ian surged into Florida, increasing by 113% w/w as retailers and wholesalers positioned supplies for the rebuilding effort. But as is always the case, flatbed volumes fall away in the weeks following the hurricane. Flatbed capacity remained flat last week, although equipment posts were still at the highest level in the previous six years for the middle of October. As a result of a decrease in load posts, last week’s load-to-truck (LTR) ratio decreased by 11% w/w from 14.30 to 12.70.
Spot Rates
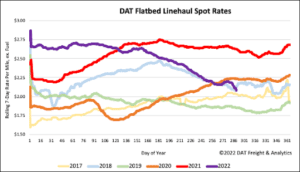
After being relatively flat since September, flatbed linehaul spot rates dropped by just over $0.07/mile last week following the spike in diesel prices. National flatbed spot rates averaged $2.14/mile last week, which is just over $0.50/mile lower than the previous year and identical to this time in 2018. Flatbed spot rates have decreased by $0.53/mile since the start of the year, with $0.51/mile occurring since June 1.
Additional Notes
Understanding Rate Trend Charts
The graphs above and below show 7-day rolling, weighted averages of spot truckload rates, updated daily and illustrated by year. The average helps to smooth out day-of-week effects, but it is plotted daily to show how things are changing in the extreme near term. DAT does not typically publish rates in this format, and as such, they will not match other figures that customers may be familiar with in our blog or other content. We are making these available to the public to help demonstrate the rapidity of changes
Need more information?
Our update will be refreshed next week, or sooner if conditions change materially. We recommend that readers visit dat.com/marketupdate for the latest information. Any questions on this report or market conditions can be emailed to askIQ@dat.com.
We are also making available, free of charge, the DAT Daily 50 which is a daily report of the top 50 lanes by volume with a week’s worth of history and predictions using the Ratecast model.