Manufacturing kept expanding in June, with the ISM Manufacturing PMI coming in at 53.3%, marking a sixth straight month of growth even as the pace eased 0.7 percentage point from May. For truckload carriers and brokers, the headline number matters less than what’s underneath it: New Orders expanded for a sixth consecutive month at 56%, and Production stayed in growth territory for an eighth straight month at 52.2%. That’s the demand signal that ultimately shows up as freight — new orders today become loads on the board in the weeks ahead, so a sustained New Orders expansion is one of the more reliable leading indicators carriers and brokers can watch for outbound volume in flatbed, dry van, and intermodal-adjacent freight tied to industrial production.
Get the clearest, most accurate view of the truckload marketplace with data from DAT iQ.
Tune into DAT iQ Live, live on YouTube or LinkedIn, 10am ET every Tuesday.
A few subindex shifts are worth flagging for capacity planning. The Employment Index improved to 49.7%, though it remains in contraction for a 33rd consecutive month — manufacturers are still cautious on headcount even as output grows, which tends to reinforce a “do more with existing capacity” posture rather than a hiring-led demand surge. Meanwhile, the Customers’ Inventories Index stayed in “too low” territory at 42.3% — generally a bullish signal for future production, since restocking needs typically translate into more outbound truckload activity down the line. On the input side, the Prices Index fell sharply to 73% from 82.1% in May, the largest one-month drop since July 2022, suggesting some of the raw materials cost pressure tied to tariffs and Middle East conflict-driven petroleum costs is easing — a modest tailwind for shippers’ margins that could support continued order flow.
Net-net, this report supports a “steady, not surging” freight backdrop for truckload carriers and brokers. Sustained New Orders and Production growth argue against a manufacturing-driven demand air pocket in the back half of the year, but the still-soft Employment picture and slower rates of growth across New Orders, Production, and Supplier Deliveries suggest this isn’t a breakout cycle either — it’s incremental expansion.
National flatbed spot rate trends
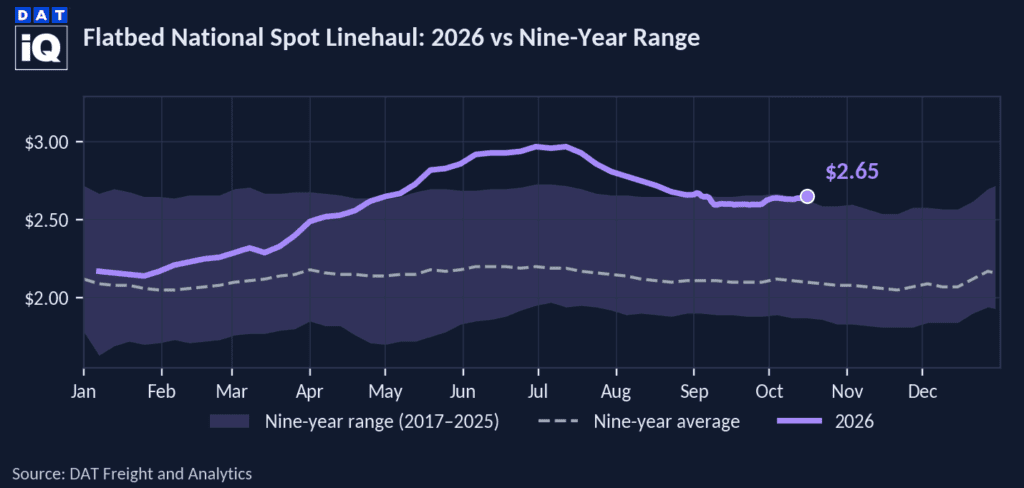
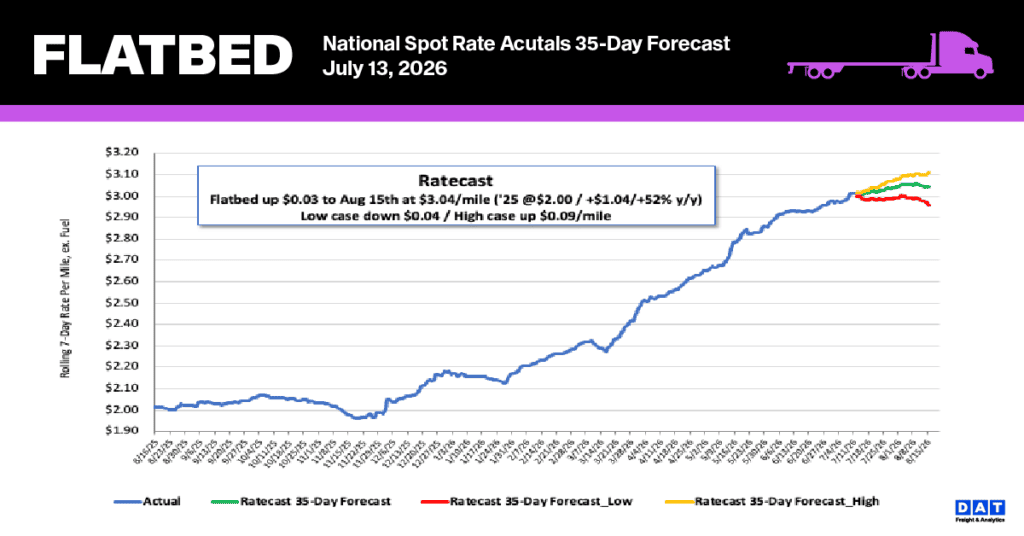
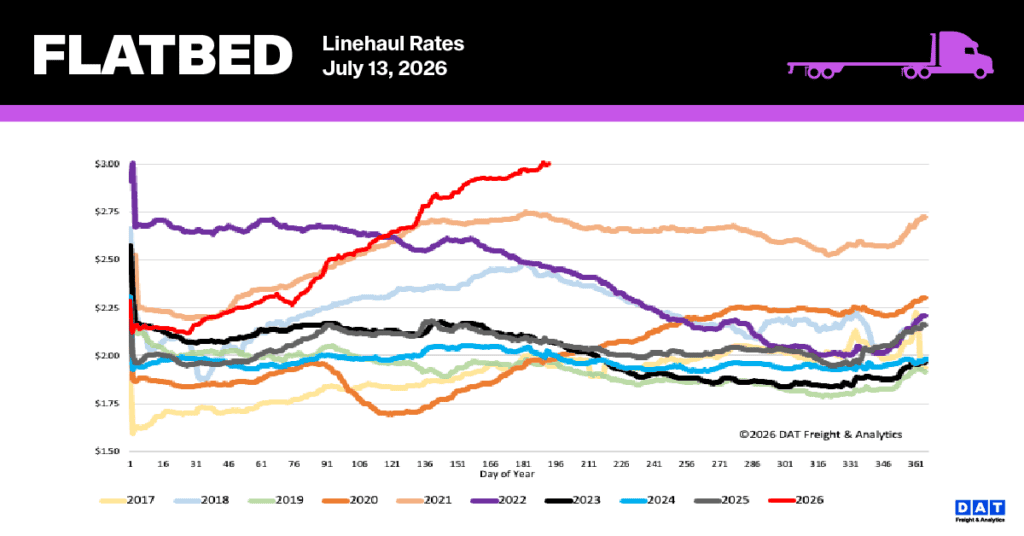
Last week, national flatbed spot rates leveled off at $3.00 per mile, following a typical seasonal plateau. Even with this stabilization, the 7-day rolling average, excluding fuel, hit a historic high that far exceeds past performance. These current rates sit 45% ($0.93) above last year’s figures and 33% ($0.98) higher than the five-year non-pandemic average. Additionally, last week’s pricing topped the previous all-time record from 2021 by 9%, representing an increase of $0.25 per mile.
- Regional bellwether performance (TX, GA, PA, AL, OK, IL, TN, SC, AR, CA): Rates in this vital 10-state industrial corridor—which accounts for nearly 55% of national load volume—increased by $0.02 to an average of $3.60 per mile as regional capacity tightened slightly.
- Market Significance: These bellwether states encompass the nation’s primary steel mills, energy hubs, and building-product plants. While the heavy nature of metals, energy, and construction freight causes weekly volatility, key markets like Texas, Georgia, and Alabama remain the most reliable indicators of the national flatbed rate trajectory.
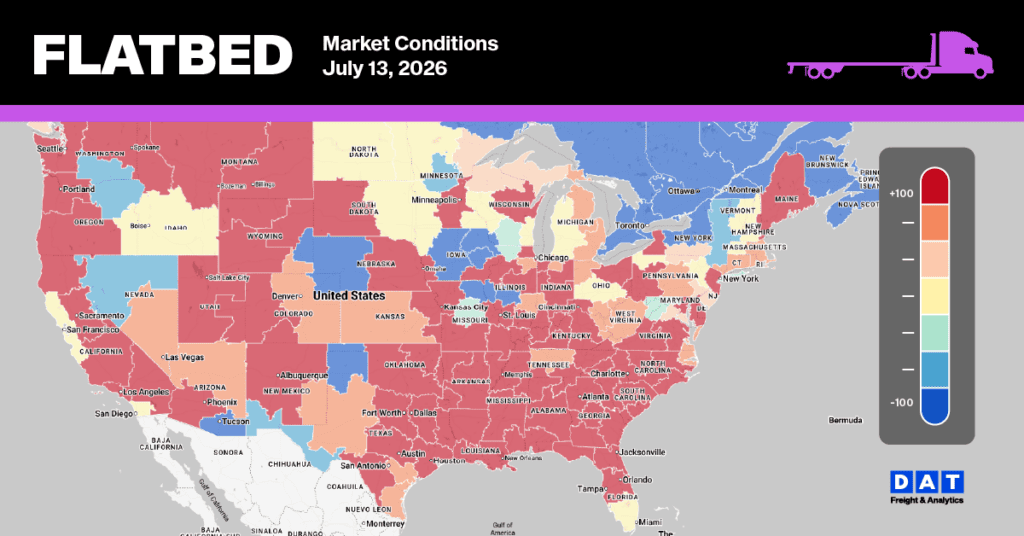
Flatbed Market Conditions
Following the holiday break, equipment availability has been slow to return to the market, dropping 6% compared to the week before the holiday and tracking 30% lower year-over-year. Meanwhile, flatbed load post volumes have entered a seasonal summer plateau, declining 12% from pre-July 4 levels but remaining 38% higher than the previous year. Driven by this tightening capacity, the national flatbed load-to-truck ratio rose by 26% to settle at 53.32.