Newly built single-family properties comprised a record share of homes on the market in the second quarter of the year, making up nearly one-third of housing inventory nationwide, according to new research from Redfin. New home sales typically make up only about 10% of the market. Low inventory levels of existing homes have kept demand solid for new homes even as the industry grapples with rising mortgage rates, elevated construction costs, and limited lot availability. Existing homeowners have been reluctant to sell because they can’t afford to give up their current low mortgage rates.
Following July’s surge in single-family home construction, the number of new homes started in August dropped 4.3% m/m, according to the latest release from the U.S. Census Bureau. For permits to build, viewed as a leading indicator for future construction, the seasonally adjusted annual rate of new permits last month was just over 5% higher than in August last year. In the Southeast Region, which accounted for 63% of single-family homes started last month, volumes increased by 8% m/m. Compared to prior years, last month’s result is 3% above 2019 but down 29% from the peak in 2021.
Get the clearest, most accurate view of the truckload marketplace with data from DAT iQ.
Tune into DAT iQ Live, live on YouTube or LinkedIn, 10am ET every Tuesday.
Market Watch
All rates cited below exclude fuel surcharges unless otherwise noted.
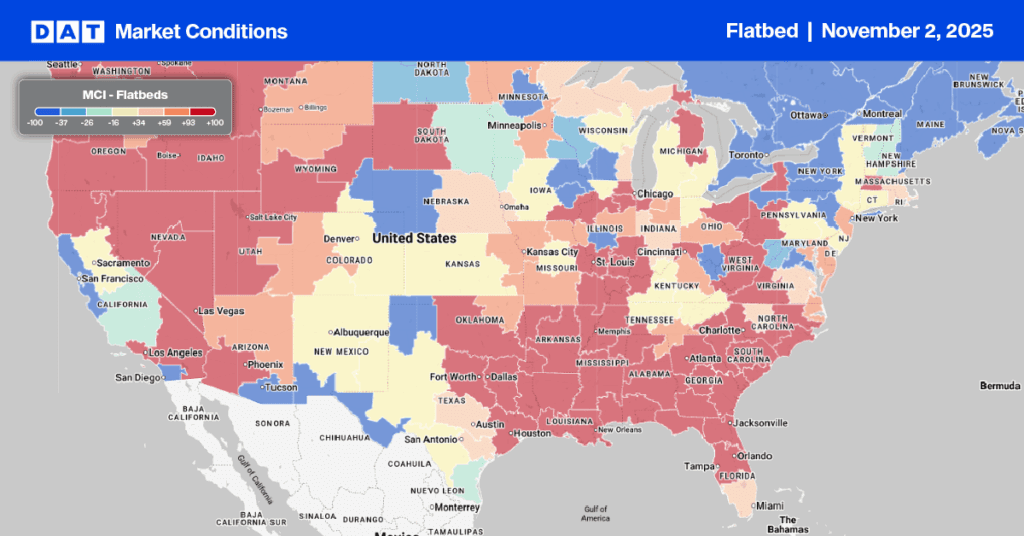
After dropping $0.21/mile over the last seven weeks, state average outbound rates in Texas increased $0.04/mile to $1.96/mile last week. Houston outbound loads paid carriers an average of $2.05/mile, an increase of $0.05/mile in the previous three weeks. On the high-volume lane to Lubbock in the Permian Basin, rates continue to fall, averaging $2.20/mile as oil rig counts dropped 18% below last year and are at their lowest level since February 2022. Spot rates on this lane are $1.19/mile lower y/y.
Outbound capacity tightened in Portland last week following a $0.34/mile w/w rate increase, which averaged $2.37/mile. Loads to Stockton paid carriers $2.33/mile, while loads to Fresno and Los Angeles averaged $2.29/mile and $1.83/mile respectively. In Indiana, flatbed rates increased for the fourth week, averaging $2.47/mile for outbound loads, while the same trend was reported in neighboring Illinois, where rates averaged $2.35/mile.
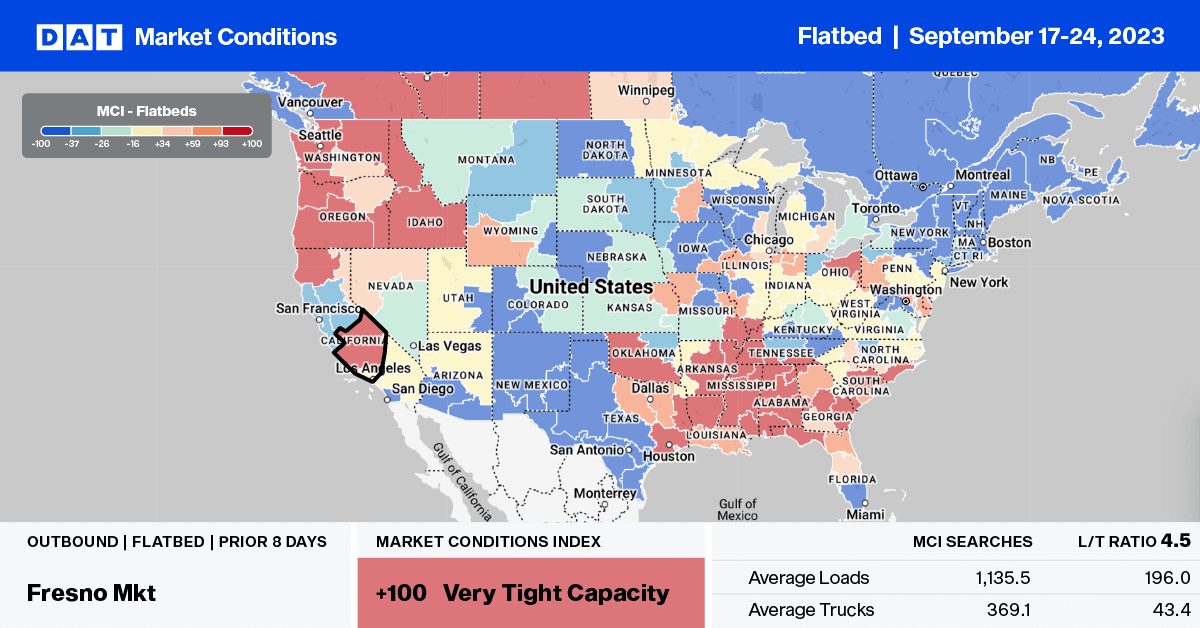
Load-to-Truck Ratio (LTR)
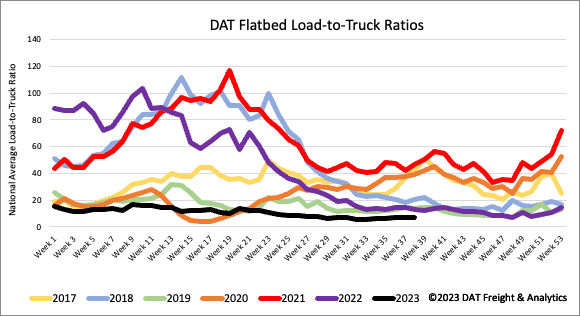
Flatbed load post (LP) volume continues to track at around half what it was in 2019 following last week’s 3% w/w decrease. Carrier equipment posts were down by just over 7% w/w, increasing the flatbed load-to-truck ratio (LTR) slightly from 6.99 to 7.11.
Spot Rates
After remaining flat over the previous two weeks, last week’s flatbed linehaul rates decreased by just over a penny per mile to a national average of $1.91/mile. Compared to last year, flatbed spot rates are $0.24/mile lower than last year and only $0.04/mile higher than in 2019.

