Port Houston handled 353,525 twenty-foot equivalent units (TEUs) in September, an increase of 26% compared to last year, according to the recent release of September data. This is the second-highest month ever for containers at Port Houston, following only August 2022. The increase in volume is largely due to demand for imported goods and a more efficient gateway, and loaded import container volume was up 31% in September over the same month last year. Overall, container volume is up 18% year-to-date at Port Houston’s terminals and is already nearing the 3M mark this year.
In addition to containerized imports, total breakbulk tonnage in Houston, which includes steel, metals, project cargo, forest products, heavy machinery, and turbines, rose to 7.5 million short tons in the first seven months of 2022, a 56% y/y increase. According to the JOC.com report, steel generally accounts for 70 to 75% of the port’s total breakbulk volumes. According to Dominic Sun, director of trade and development for Port Houston, breakbulk volumes surged in 2022, thanks primarily to increased oil and gas production in the region. According to the latest BakerHughes Rig Count, the number of oil drilling rigs, large consumers of drill pipe and casing, have also increased 48% in the last 12 months.
Market Watch
All rates cited below exclude fuel surcharges unless otherwise noted.
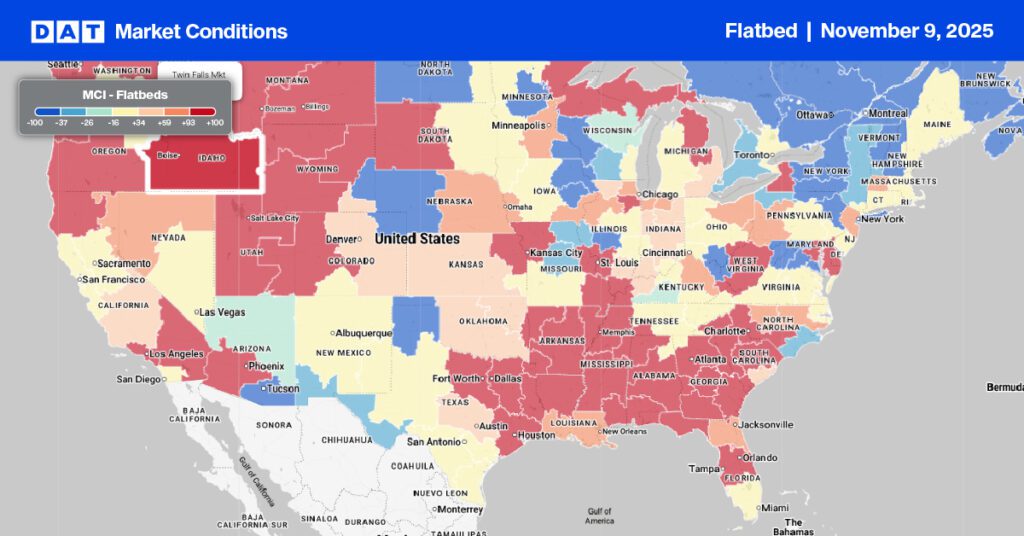
Flatbed capacity tightened last week in Texas following a 2% w/w increase to an average outbound rate of $2.28/mile. That’s around $0.25/mile lower than the state average for the previous year but the second highest in the last seven years at the start of November (2021 was the highest at $2.53/mile). In Houston’s largest flatbed spot market, load posts increased by less than 1% last week, while outbound capacity remained flat at $2.40/mile for all outbound loads. On the high-volume lane 600 miles west, loads from Houston to Lubbock in the Permian Basin oilfield have decreased steadily since July, averaging $2.86/mile last week.
On the number one lane from Houston to Ft. Worth measured by loads moved, which were down 13% last week, spot rates averaged $2.86/mile last week, which is almost $0.50/mile lower than the previous month and $0.35/mile lower y/y. Capacity was tight again in San Antonio last week, where spot rates spiked by almost $0.20/mile to $2.61/mile for outbound loads. Regional loads to El Paso averaged $2.13/mile last week, up $0.18/mile m/m and y/y, while loads 900 miles west to Tucson, AZ, were much higher at $2.36/mile after increasing steadily since August.
Load-to-Truck Ratio (LTR)
Flatbed load posts are around 70% lower than the previous year as the flatbed sector continues to cool heading into winter. Volumes decreased by 4% last week, and compared to the most recent non-pandemic year when flatbed demand was strong, load posts are still almost 10% higher than in 2018. Equipment posts were still at the highest level during the last six years at the start of November, following the previous week’s 2% decrease. As a result of a reduction of load and equipment posts, last week’s load-to-truck (LTR) ratio decreased slightly from 11.64 to 11.41.
Spot Rates
Flatbed linehaul spot rates have dropped by $0.14/mile in the previous month following last week’s $0.02/mile decrease. National flatbed spot rates averaged $2.07/mile last week, just under $0.55/mile lower than the previous year, $0.12/mile lower than this time in 2018, and still $0.03/mile higher than in 2017.
Additional Notes
Understanding Rate Trend Charts
The graphs above and below show 7-day rolling, weighted averages of spot truckload rates, updated daily and illustrated by year. The average helps to smooth out day-of-week effects, but it is plotted daily to show how things are changing in the extreme near term. DAT does not typically publish rates in this format, and as such, they will not match other figures that customers may be familiar with in our blog or other content. We are making these available to the public to help demonstrate the rapidity of changes
Need more information….
Our update will be refreshed next week, or sooner if conditions change materially. We recommend that readers visit dat.com/marketupdate for the latest information. Any questions on this report or market conditions can be emailed to askIQ@dat.com.
We are also making available, free of charge, the DAT Daily 50 which is a daily report of the top 50 lanes by volume with a week’s worth of history and predictions using the Ratecast model.