Capacity migration is a subject often underestimated and misunderstood by industry experts. Most successful small fleets and owner-operators have a variety of trailer types at their disposal, enabling them to switch between modes based on spot rate and demand levels. An example could include a reefer carrier that changes to bulk liquid haulage in winter, a flatbed carrier that hauls produce in summer using a spare or rented reefer trailer, or a dry van carrier that switches to dray haulage with a chassis trailer.
And it’s not just about trailer types. Some truckers also add a wet line system to their truck, enabling them to use a PTO (power take-off) for end dumps, live bottom floor, or heavy-haul trailers. The examples are endless, but the point is that capacity is constantly shifting between modes depending on market conditions and seasonality.
Truckers will tell you there are only two seasons – winter and construction – and we’re in what’s been described as a “golden age” for highway and bridge funding following the $1.2 trillion Infrastructure Investment and Jobs Act. Randy Lake, CRH CEO, said, “That bill is set to boost federal funding for highways between 40% and 50%.” Even though flatbed demand is sluggish in the residential construction sector, some carriers are reporting solid demand for significant infrastructure projects involving machinery, steel, and prefabricated concrete. Anecdotal evidence suggests many carriers have parked their primary trailer, whether a flatbed, dry van, or reefer, and switched to dump trailers hauling asphalt or removable goose-neck (RGN) trailers moving machinery.
Market Watch
All rates cited below exclude fuel surcharges unless otherwise noted.
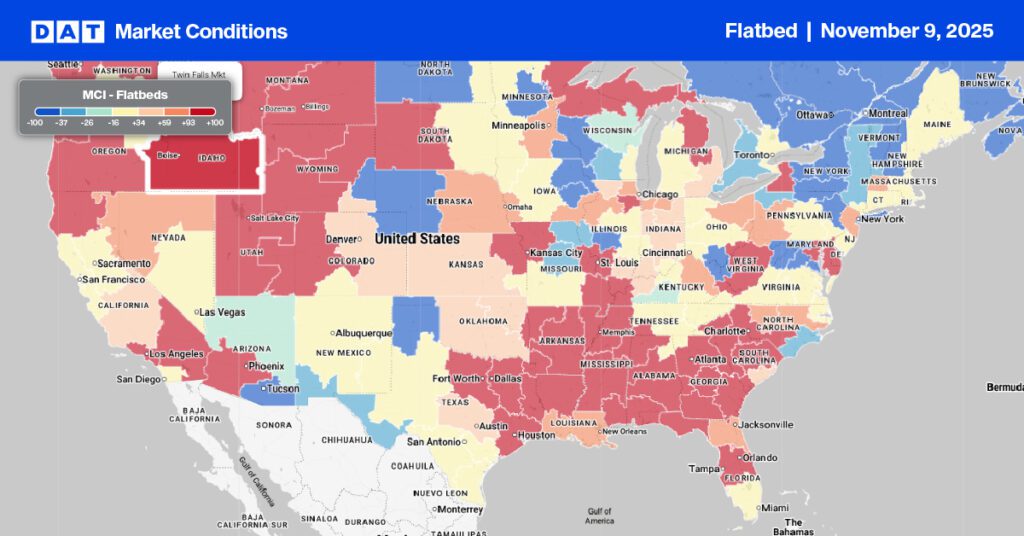
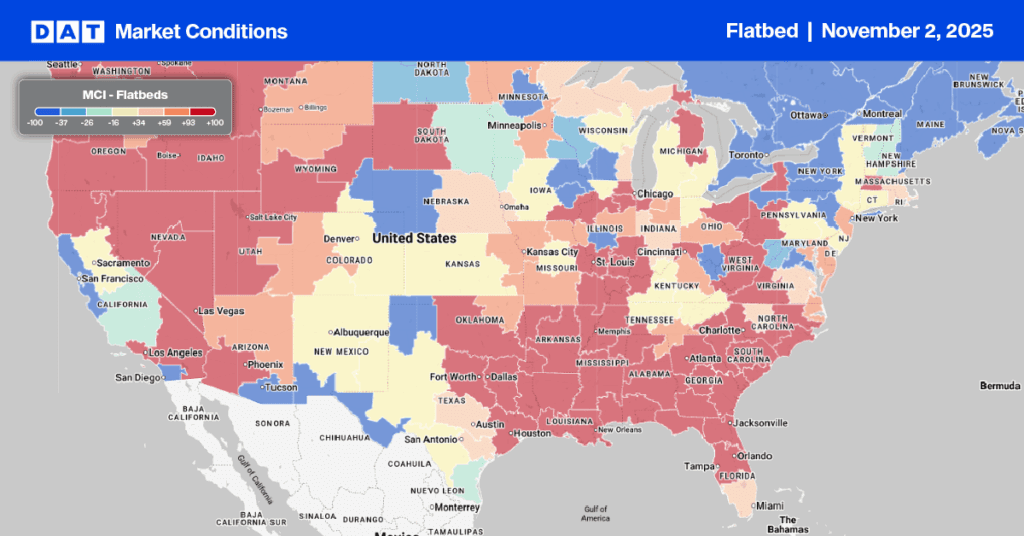
Flatbed carriers in California were paid an average of $2.26/mile for outbound loads following last week’s $0.04/mile gain. Solid gains were reported in San Diego following last month’s 4% increase in breakbulk import tonnage; linehaul rates increased by $0.22/mile to an average of $2.34/mile. At $2.40/mile, New Jersey’s state-average rate increased by $0.02/mile last week but remained $0.09/mile lower than in 2019.
In Miami, capacity tightened for the third week, with spot rates up $0.20/mile to an average of $2.14/mile, while in the larger spot market in Lakeland, rates dropped by $0.16/mile to $1.70/mile following a 5% w/w decrease in loads moved.
Linehaul rates have steadily increased in Indianapolis over the last month to $2.82/mile for outbound loads, while loads to Atlanta paid carriers $2.23/mile, the highest since April, but $0.41/mile lower than in 2022.
Load-to-Truck Ratio (LTR)
Even though load posts bounced back following last week’s 42% w/w increase, the flatbed spot market continues to soften as volumes track close to 60% lower than in 2022. Compared to prior years, load posts are 61% lower than the long-term pre-pandemic average for Week 28, including 59% lower than in 2019. Carrier equipment posts increased by 38% w/w, resulting in last week’s flatbed load-to-truck (LTR) ratio increasing from 7.87 to 8.07.
Spot Rates
After mainly being flat in May and June, flatbed linehaul rates have continued that trend into July as the national average linehaul rate holds steady at around $2.09/mile. The national average flatbed spot rate is $0.37/mile lower than the previous year and around $0.12/mile higher than in 2017 and 2019.