Spot market freight was stuck in neutral for most of the third quarter, with some pockets of seasonal activity. It’s not unusual for the spot market to experience a lull in Q3, but this year, the slack demand combined with an increase in capacity, and load-to-truck ratios dropped below two loads per truck for vans.
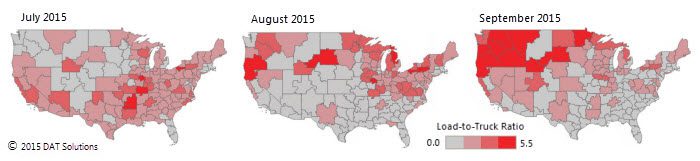
A quiet July and even quieter August are illustrated in the Hot Market Maps above, as low (grey) load-to-truck ratios dominated much of the country throughout the summer. Heightened demand turned parts of the map red during the second half of September, however, as shippers scrambled to close the third quarter on a solid footing. Capacity was tightest in the Pacific Northwest, as fall harvests of apples, potatoes and onions rolled to market in vans as well as reefers.
Now compare September 2015, the right-hand map above and below, with the same month in 2014 and 2013:

Tight capacity led to much “hotter” map views in 2013 and 2014, although the seasonal trend is fairly consistent in the Northwest for all three years. Recognizing that 2014 was extraordinary in many ways, the past month looks anemic even when compared to the more typical freight movement of September 2013.
Load-to-truck ratios signal changes in the marketplace that are usually reflected in truckload rates. In the past five years, a change in the load-to-truck ratio has correlated at a rate of 0.8 with an immediate change in spot market rates, and a sustained change in spot market rates is typically followed by a change in contract rates, as well.
This tendency is clearest when we look at the line haul rate, not including the fuel surcharge:

Beginning in January 2014, severe weather squeezed truckload capacity in the northern band of U.S. states, and load-to-truck ratios spiked, as seen in the dotted line on the graph, above. Spot market rates (orange line) rose immediately, and contract rates (brown line) began to climb in April. By December, spot market rates had peaked but contract rates continued to rise for the largest fleets.
Contract carriers bought a record number of trucks last year and boosted driver pay, to regain capacity and market share that they lost to spot market providers in 2015. Those efforts don’t come cheap, but shippers have proved willing to pay a premium to lock in capacity and minimize future supply chain disruptions. Large carriers have taken advantage of these trends to “cherry pick” freight that fits best within their networks, provides their drivers with predictable and desirable routes, and enables the carriers to offer premium service to their preferred shippers.

The gap has widened between shipper-to-carrier contract rates and the spot market rates that freight brokers pay to the carrier. As of last week, that gap has grown to 18% (25¢ per mile) on national average line haul rates for vans, not including the fuel surcharge.
In October 2014, the gap was much narrower at 8%. This trend represents an opportunity for freight brokers, who can offer spot market capacity to shippers at a competitive price.

A steep decline in the cost of fuel has also played a huge role in the past year’s rate trends, as a declining fuel surcharge moderates the rising line haul rate on the contract side, and gives the spot market rate an even more pronounced downward trend. In the above graph, per-mile rates are compared again, but with the average fuel surcharge added.
The trends create opportunity for freight brokers, who can offer competitive pricing to their shipper customers while paying a fair rate to carriers who haul spot market loads. Small carriers can get by with a lower rate in the short term, because fuel is relatively cheap.
The gap may narrow again between spot and contract rates, for a variety of reasons. First, contract carriers will adjust their pricing to avoid losing market share to freight brokers and 3PLs. Second, small carriers will exit the market if rates drop below their breakeven threshold, or if increased costs and new regulations hamper productivity. An increase in overall freight volume would also tip the balance, as the additional demand would likely exceed contract capacity. Then spot market rates will rise, or perhaps contract rates will fall, as shippers adjust to the new conditions.
Rate benchmarks, capacity analytics, carrier validation and monitoring and an affordable, full-featured transportation management system (TMS) all complement your DAT load board service, to give freight brokers an end-to-end solution for capacity management. With broker solutions from DAT, your company can stay on top of emerging trends before they affect your bottom line, Contact DAT for additional info, by calling 800.551.8847 or by submitting this online form.