Trucking activity in the United States slipped in June as the freight market eroded during the last two months of the second quarter. Specifically, truck freight tonnage decreased 0.4% after falling 0.1% in May, according to the American Trucking Associations’ advanced seasonally adjusted For-Hire Truck Tonnage Index.
Get the clearest, most accurate view of the truckload marketplace with data from DAT iQ.
Tune into DAT iQ Live, live on YouTube or LinkedIn, 10am ET every Tuesday.
“After a strong start to the second quarter, with tonnage levels increasing sequentially and from a year earlier in April, freight levels eased in May and June,” said ATA Chief Economist Bob Costello. “In the second quarter, truck tonnage was essentially flat, increasing 0.2% from the first quarter, but falling 0.2% from a year earlier. Freight levels have been helped recently by small gains in factory output and retail sales, but weaker construction activity, especially for single-family homes, has been a drag on volumes.”
The ATA Tonnage Index is dominated by contract freight, as opposed to traditional spot market freight. The tonnage index is calculated on surveys from its membership and has been doing so since the 1970s. This is a preliminary figure and subject to change in the final report issued around the 5th day of each month. The report includes month-to-month and year-over-year results, relevant economic comparisons, and key financial indicators.
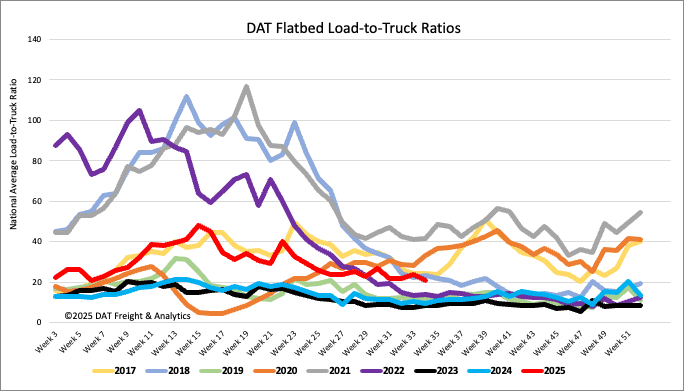
Load-to-Truck Ratio
Last week, flatbed load post volumes remained relatively flat, yet were approximately 30% higher than the previous year. A slight decrease in carrier equipment posts led to an increase in the load-to-truck ratio, reaching 21.20.
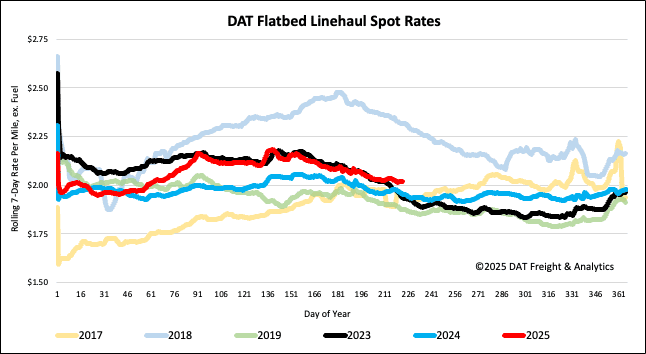
Spot rates
Last week, the national average flatbed spot rate, excluding fuel, saw a modest increase of one cent, reaching $2.04 per mile, after a significant drop the previous week. This new rate is $0.09 per mile higher than the same week in 2024 and $0.11 per mile higher than in 2023.