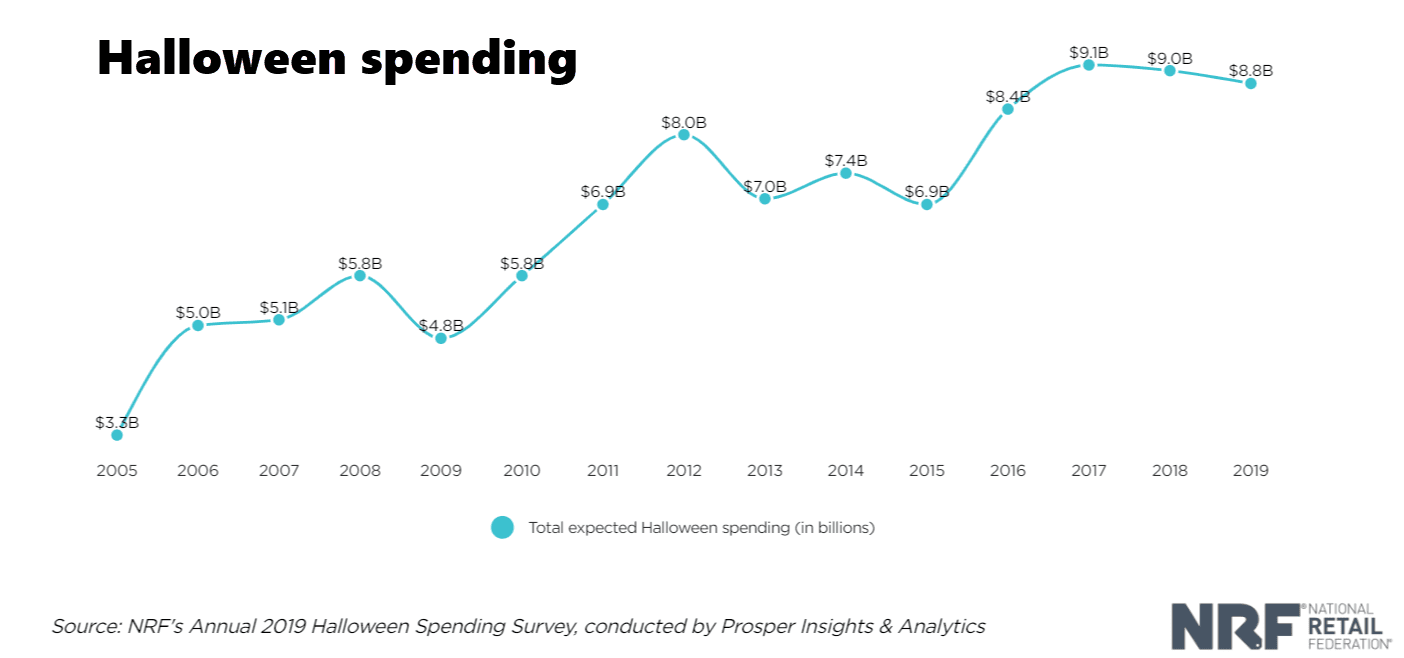
Remember when retailers would set aside a few shelves for Halloween candy and costumes? Times have changed. Today there are entire stores filled with Halloween merchandise, and over the past decade, Halloween spending has nearly doubled. This year consumers are expected to spend $8.8 billion on Halloween-related purchases, according to a recent survey by the National Retail Federation.
That’s a lot of freight.
While much Halloween merchandise has already made its way from ports to distribution centers to retail stores, many items — including pumpkins and food products — are still moving on our nation’s roadways.

Halloween spending habits
According to the National Retail Federation, 172 million people plan to celebrate Halloween this year. The top items celebrants plan to purchase include candy (95%), decorations (72%) and costumes (67%).
While online shopping is a growing catergory, only 25% of respondents said they would purchase Halloween items online. Forty-two percent say they will buy Halloween merchandise at a discount store, 36% at a specialty Halloween or costume store, 25% will buy at a grocery store, and 23% will visit a department store. And while the survey found that the trade war with China is causing some uneasiness among consumers, it noted that most Halloween merchandise was in the country before the 15% tariffs took effect on Sept. 1.
Pumpkins on the move
And then there are pumpkins, which need to be picked and transported within a narrow window. Harvest too early and they won’t last until Oct. 31. Deliver too late and — who wants to buy a pumpkin after Halloween? To see the rise and fall of pumpkin season, all you have to do is look at DAT’s Hot Market Maps, available in the DAT Power load board and DAT RateView. Last week Albuquerque, NM, normally a quiet freight market, lit up on the Hot Market Map. The load-to-truck ratio was 11:1 for vans and 25:1 for reefers.
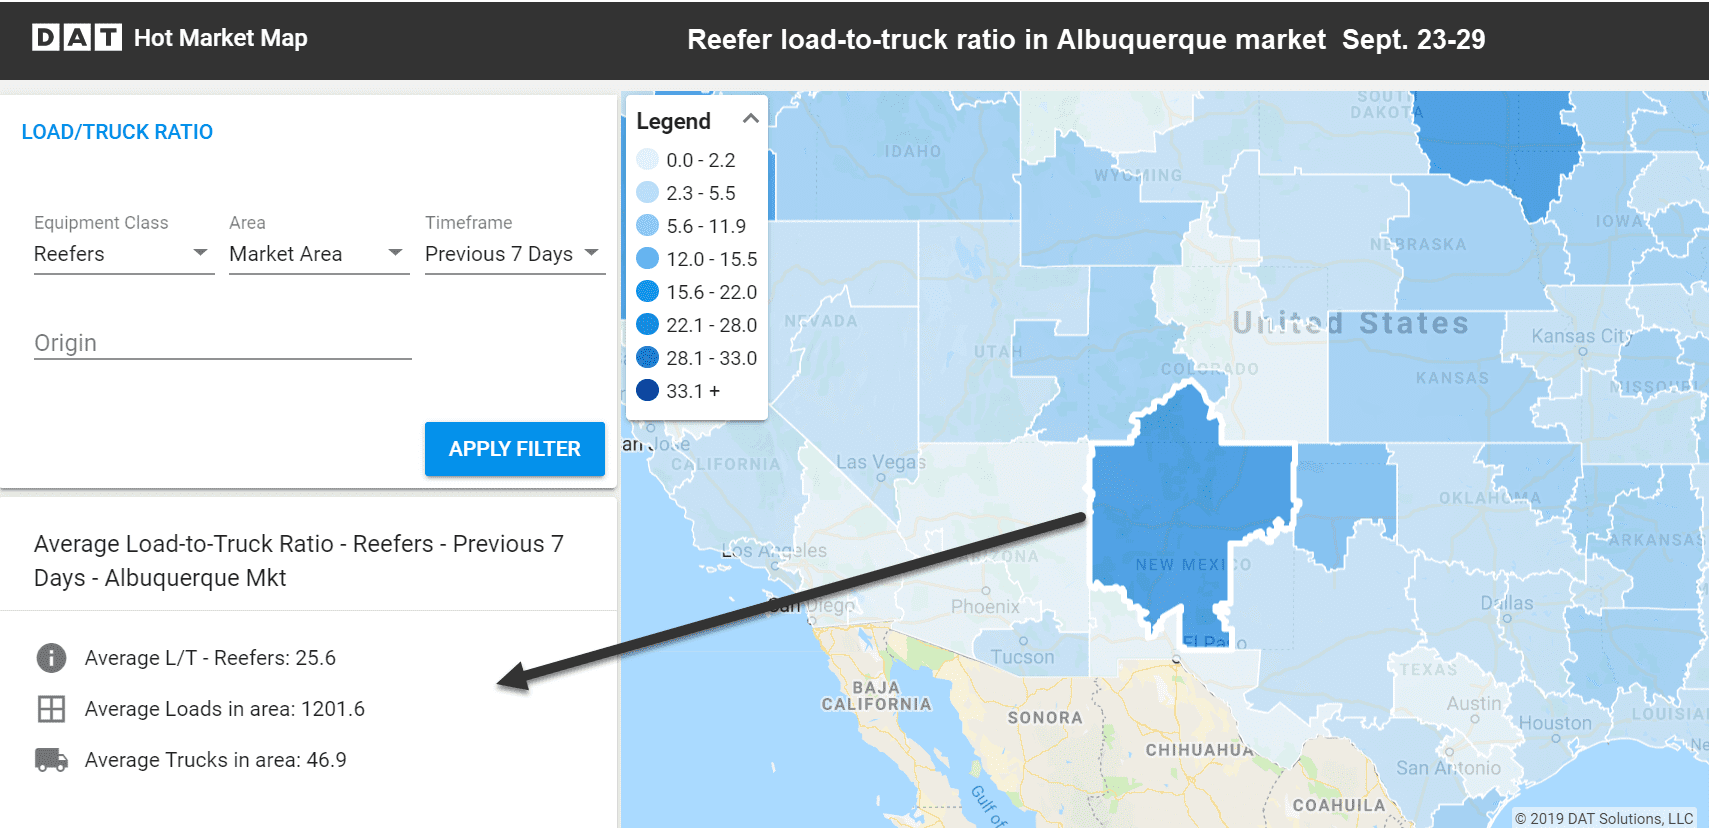
Last week in the Albuquerque market there were more than 1,200 reefer load posts and only 47 truck posts, for a load-to-truck ratio of 25 to 1. Map from DAT RateView.
What about you? If you’re a carrier or a broker, what Halloween-related fright are you moving now? Have any interesting stories? Let us know in the Comments section below.
Want to see load-to-truck ratios in 135 freight markets and average rates in more than 65,000 lanes? Learn more about DAT RateView.