For flatbed and specialized carriers in the agriculture sector, demand continues to improve with April’s tractor and combine retail sales exceeding the average of the last five years by 33%.
“April was the month we were watching to see how this growth trend would look once it hit the official twelve-month mark,” says Curt Blades, Senior Vice President of Ag Services at the Association of Equipment Manufacturers. “Seeing the larger row-crop units leading the way in segment gains shows the pull rising commodity prices have been having on equipment sales.”
U.S. farm tractor unit sales continue double-digit growth in both the U.S. and Canada after April’s strong farm tractor sales. The U.S. total farm tractor sales is up 22.7% since last April. Compared to the first four months of 2020, sales are up 39% year to date.
The bulk of April’s tractor retail volume were two wheel-drive tractors with less than 40 horsepower. This class accounted for 72% of sales in April. Sales are up 21% this year and 43% YTD.
In the four wheel-drive and self-propelled combine segments, sales are up 12% this year and 9% YTD.
Find loads and trucks on the largest load board network in North America.
Note: All rates exclude fuel unless otherwise noted.
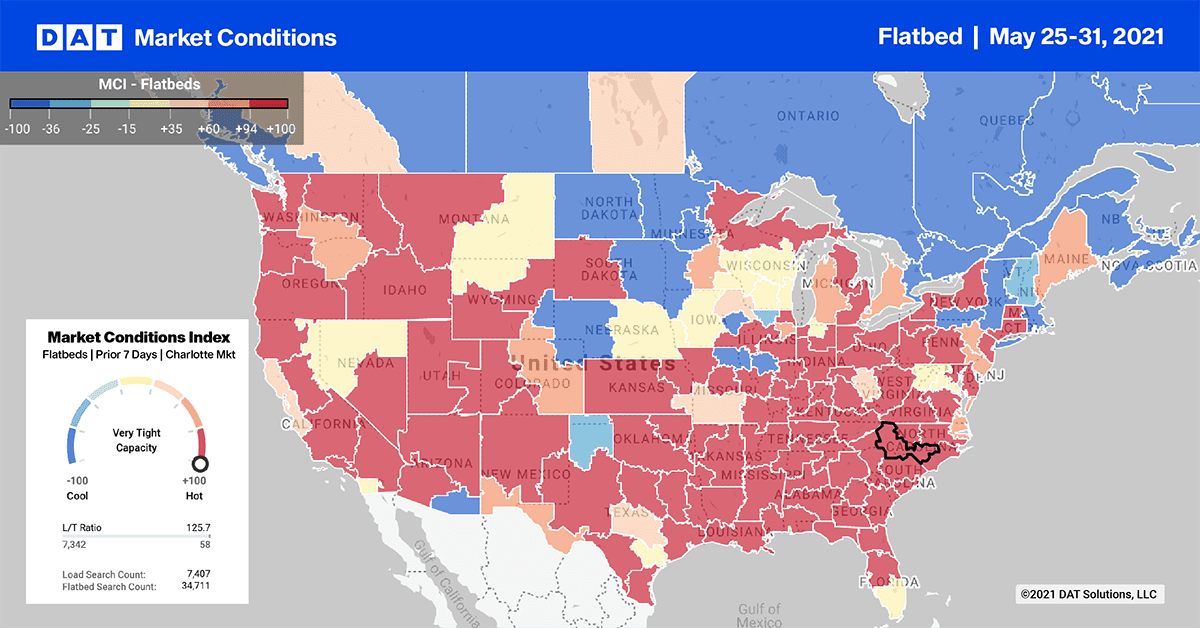
Capacity remains tight in the top 10 flatbed markets even though load post volumes dropped by 8% last week. Spot rates jumped another $0.16/mile last week to reach an average of $3.65/mile. In the Mid-South region, which accounts for 16% of weekly volume covering a 300-mile radius around Decatur AL, volumes were down 8% while rates were up $0.12/mile to an average of $3.88/mile.
Spot rates
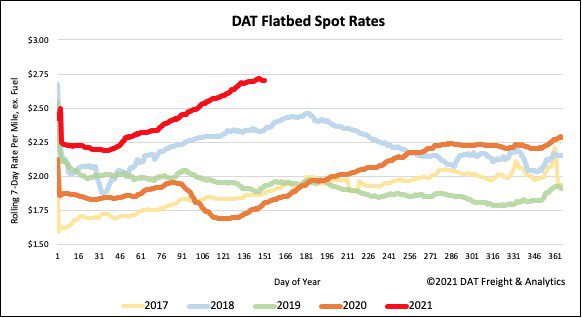
With spot market load post volumes dropping, it appears flatbed spot rates have definitely crested at a record-high of $2.70/mile. It now appears to be heading down as they did around this time in 2018. Flatbed rates are still $0.90/mile higher than the same week last year and $0.24/mile higher than the same time in 2018.
How to interpret the rate forecast:
- Ratecast: DAT’s core forecasting model
- Short Term Scenario: Formerly the pessimistic model that focuses on a more near-term historical dataset
- Blended Scenario: More heavily weighted towards the longer-term models
- Blended Scenario v2: More heavily weighted towards the shorter-term models
