This year, the focus of the Commercial Vehicle Safety Alliance’s (CVSA) International Roadcheck Week was on wheel ends. Out of the top 10 vehicle out-of-service violations, tires ranked second, and wheels came in seventh. Of the 18,213 total vehicle out-of-service violations, there were 3,374 out-of-service tire violations, accounting for 18.5% of all vehicle out-of-service violations, and there were 784 wheel out-of-service violations, which is 4.3% of all vehicle out-of-service violations.
Get the clearest, most accurate view of the truckload marketplace with data from DAT iQ.
Tune into DAT iQ Live, live on YouTube or LinkedIn, 10am ET every Tuesday.
Combined, wheel end (tire and wheel) violations accounted for 22.8% of all out-of-service vehicle violations throughout North America. Over the three days of the Roadcheck Week, CVSA-certified inspectors conducted 59,026 inspections and placed 12,456 commercial motor vehicles and 3,714 commercial motor vehicle drivers out of service.
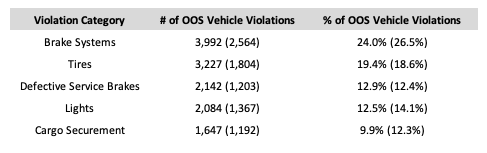
United States: Top Five Vehicle OOS Violations (2021 in brackets)
What does being placed out-of-service (OOS) mean?
During a roadside inspection, a commercial motor vehicle is placed out of service when an inspector finds critical safety out-of-service violations. Being put out of service means the driver or vehicle is prohibited from operation for a specified period of time or until the violation is corrected. With operating costs as high as they’ve ever been, being placed in OOS is a real expense to the carrier beyond the cost of repairs, as much as $1,500 per day.
CVSA inspectors in Canada and the U.S. conducted 36,555 Level I inspections (a 37-step process that checks the driver’s operating credentials and requirements and the vehicle’s mechanical fitness and regulatory compliance) last May. As a result, they placed 8,718 vehicles out of service, a 23.1% vehicle out-of-service rate for North America. However, that also means that 77.2% of the vehicles and 93.6% of the drivers inspected did not have out-of-service violations.
In Canada, the total number of inspections was much less. Still, as a percentage of total OOS vehicle violations, brake systems accounted for 38%, followed by cargo securement at almost 19% and defective brakes at 10%. In addition to vehicles being inspected, drivers were also subjected to various inspections, with false logs accounting for almost 45% of OOS driver violations in the U.S., followed by incorrect license class at 24.7% and suspended license at 6%. In Canada, where electronic logging devices have been mandated but won’t be enforced until next year, hours of service violations accounted for just over 76% of driver OOS violations.


