The May 2021 reading of the for-hire trucking ton-mile index produced by Yemisi Bolumole and Jason Miller at Michigan State University (MSU) shows the index declined 0.6% from April. It’s the second straight month of decrease on a seasonally adjusted basis.
“The May result isn’t surprising given the March 2021 reading is the 2nd highest ever (after May 2018) and there is less long-haul capacity today than in May 2018,” says Professor Miller. “This helps explain why May 2021 saw the highest dry van linehaul prices of all time.”
The ton-mileage index is derived from the physical quantity output for 41 different industry sectors that generate freight. It shows three distinct peaks of trucking activity since 2004:
- 2007: Q2 and Q3
- 2008: Q2
- 2021: Q1 and Q2
Following the MSU index trend was the latest reading of the Cass Freight Index. It reported shipments declined by 4.2% in June but it is still up 26.8% this year.
“While still among the top ten results in the past decade, the result indicates a slightly slower volume environment than May,” notes Tim Denoyer. This is consistent with several other broad freight measures, including rail volumes and spot truckloads. Like most industries shipment volumes continue to be hindered by supply constraints, which range from driver and trailer shortages in TL and LTL to chassis shortages hampering intermodal capacity.”
Find loads and trucks on the largest load board network in North America.
Note: All rates exclude fuel unless otherwise noted.
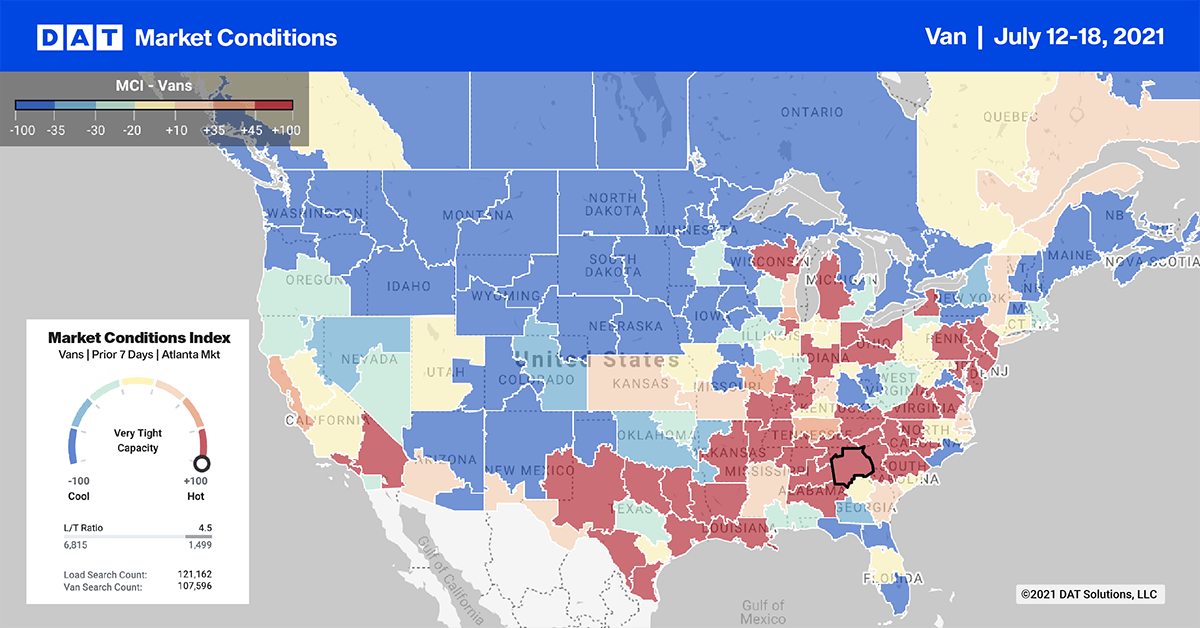
In Stockton, CA, where the bulk of e-commerce imported goods are warehoused after arriving from Los Angeles, outbound rates reached new heights. Rates for dry van loads to Portland, OR, hit a 12-month high last week, reaching $4.17/mile. That’s up $1.37/mile since February.
On the 338-mile run from Los Angeles to Stockton, one of the highest freight volume lanes in the country, spot rates are even higher at $4.27/mile this week. Loads east to Phoenix from Los Angeles continue to climb reaching a 12-month high of $4.46/mile this week. This is $0.29/mile higher than the $4.17/mile peak last October when overseas imports from Asia were surging.
In one of the larger warehouse freight markets on the East Coast, rates from Allentown, PA to Richmond, VA spiked last week. They increased by $0.58/mile to $4.23/mile after sitting around $3.65/mile for the last nine months.
Spot rates
Spot rates exhibited more seasonality last week. Rates decreased slightly by just less than $0.01/mile to $2.42/mile. That’s two weeks in a row where spot rates have been sliding. However, it’s still nowhere near the rate of decrease we’d normally expect to see in the weeks immediately after July 4. Dry van rates are still 25% higher, or $0.69/mile, than this time last year.
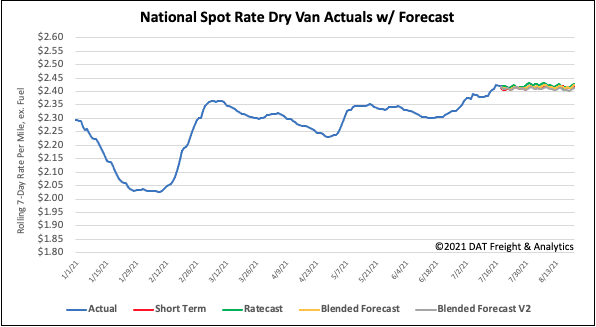
How to interpret the rate forecast:
- Ratecast: DAT’s core forecasting model
- Short Term Scenario: Formerly the pessimistic model that focuses on a more near-term historical dataset
- Blended Scenario: More heavily weighted towards the longer-term models
- Blended Scenario v2: More heavily weighted towards the shorter-term models


