The recent Journal of Commerce truckload carrier earnings call gave us some insight into what demand is expected to look like for the rest of the year: it’s all up. As shippers struggle to replenish depleted inventories and import volumes at ports continue to experience delays, truckload demand shows no sign of slowing down.
Jeffrey Lorberbaum, Chairman and CEO of flooring company Mohawk Industries, said in their July 30 earnings call:
“Without needed factory and warehouse workers, goods aren’t produced and shipped on time. What we expect to happen doesn’t happen and that failure of expectations is being replicated across industry sectors and supply chains, globally. If the demand stays high, there’s a chance that given all these constraints, we won’t be able to build much inventory until we hit the end of the year or it could be further.”
On the driver supply side there’s still a shortage of drivers to seat trucks.
“We can’t even find bad drivers let alone good ones; it’s so desperate at the moment,” one carrier told DAT & Freight Analytics.
“The driver market has become worse as the year has played out,” says Derek Leathers, CEO of Werner Enterprises. “Driver wage increases are accelerating as well, with driver pay at Werner up 11% year-over-year at the end of the second quarter. We still have some targeted, strategic driver pay raises that are going into effect, both in dedicated and in one-way (over-the-road truckload).”
Find loads and trucks on the largest load board network in North America.
Note: All rates exclude fuel unless otherwise noted.
West Coast ports including Seattle, Portland, Oakland, Long Beach and Los Angeles are increasingly looking like being the center of attention for the next few months — and certainly until the end of 2021.
The Delta variant is impacting Asia, including Vietnam and China. Factory shutdowns are imminent and very tight ocean capacity on the Transpacific trade lane will continue to disrupt vessel schedules. This in turn will create “bunching” of vessels in ports. We can expect peaks and troughs in import container volumes, resulting in surge volumes for truckload carriers in the spot market.
The Marine Exchange notes that there are 29 container vessels waiting at anchor to unload in Southern California. This is almost triple the number at anchor just four weeks ago.
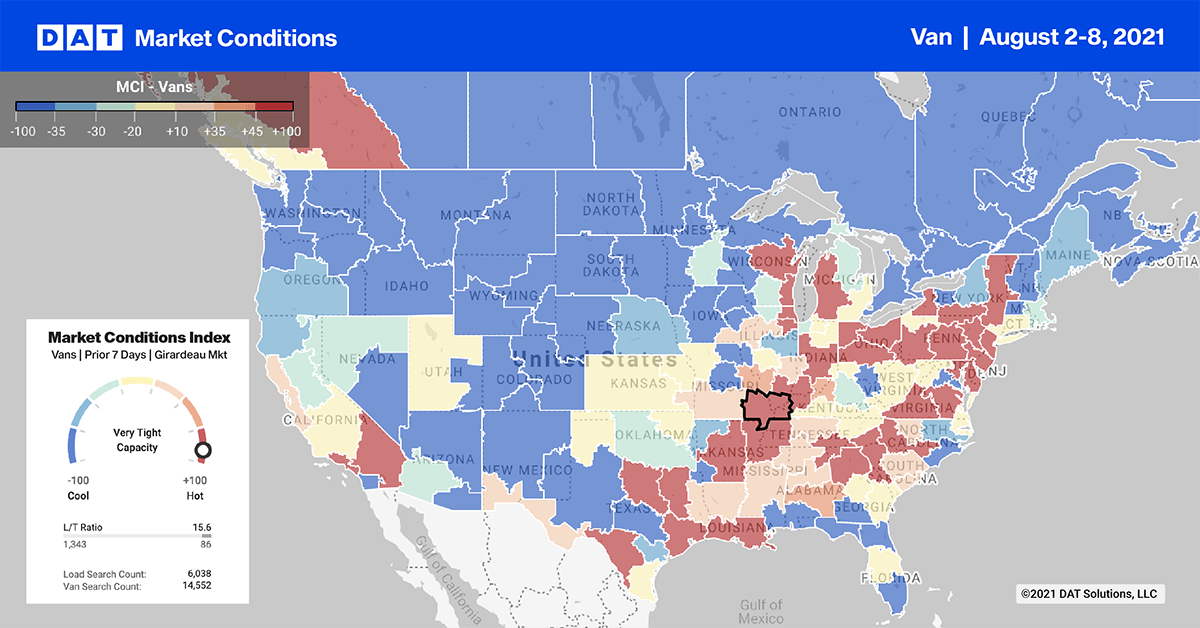
One of the features of the pandemic-driven freight market has been the inability of contract carriers to handle surge volumes over and above previously committed capacity with the spot market picking up the slack. Spot market load post volumes are still 31% higher than this time last year and even 85% higher than the same period in 2018.
The Port of Los Angeles, the larger of the two ports in the San Pedro Complex, is now busier than it’s ever been in its 114-year history.
“From the summertime of 2020 until now, we’ve been averaging more than 900,000 container units every month,” says Gene Seroka, Executive Director for the Port of L.A. “That used to be a strong month in the peak season.”
In the Ontario truckload market where the majority of import containers are transloaded into 53’ dry vans or intermodal containers, load post volumes were down 5% last week. However, spot rates were up $0.01/mile to an average of $3.19/mile.
On some lanes dominated by ecommerce retail import volumes, rates are much higher than average. Consumer demand continues to stretch supply chains and retailers shift from the back-to-school season to the peak shipping season for winter holiday merchandise.
Volumes from Los Angeles to Phoenix were up 2% last week, but rates cooled dropping to $3.92/mile. Loads moved on the high-volume Los Angeles to Chicago ecommerce freight lane continue to climb, increasing by 10%. Spot rates increased by $0.03/mile to $2.94/mile.
Spot rates
Dry van spot rates continued their unseasonal upward trend last week increasing by just over $0.01/mile to an average of $2.43/mile. Dry van rates are still $0.47/mile higher than this time last year and $0.59/mile higher than the same period in 2018.
On our Top 100 lanes, spot rates were neutral on almost half with rates up on just 35% and down on 22% of the lanes.
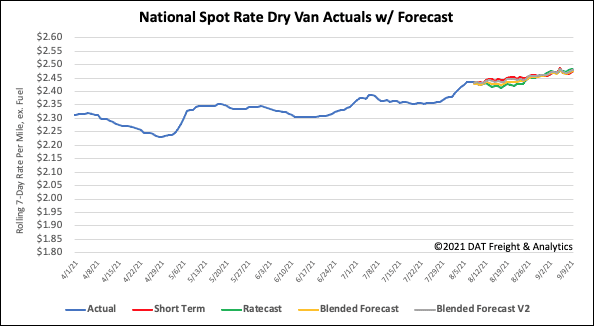
How to interpret the rate forecast:
- Ratecast: DAT’s core forecasting model
- Short Term Scenario: Formerly the pessimistic model that focuses on a more near-term historical dataset
- Blended Scenario: More heavily weighted towards the longer-term models
- Blended Scenario v2: More heavily weighted towards the shorter-term models