The trucking ton-mile index experienced a seasonally adjusted increase of 0.8% month-over-month and 1.5% year-over-year in July, despite a slight dip in the not seasonally adjusted version due to reduced motor vehicle production. This growth contrasts with declines seen in other volume data like Cass and FreightWaves. The primary drivers of this strengthening index are subsectors within wholesale trade and primary metals manufacturing. Notable year-over-year growth was observed in primary metal manufacturing (+4.2%), computer & professional equipment wholesale (+9.6%), electrical equipment and goods wholesale (+17.2%), miscellaneous durable goods wholesale (+8.3%), drug & druggist sundries wholesale (+11.7%), and raw farm product wholesale (+11.8%), with some of this growth linked to the AI boom.
Get the clearest, most accurate view of the truckload marketplace with data from DAT iQ.
Tune into DAT iQ Live, live on YouTube or LinkedIn, 10am ET every Tuesday.
Despite this positive reading, the current year-over-year growth of around 1.2% in 2025 is significantly lower than the 2-2.5% seen in 2017, according to Professor Jason Miller. This, combined with the specific nature of the demand growth, suggests that the increase isn’t substantial enough to cause a “demand shock” that would push carrier capacity utilization to a point where spot market rejections increase. The key question for the latter half of the year is whether these volumes will persist, especially as higher tariff rates and a likely seasonal decline in import volumes come into effect.
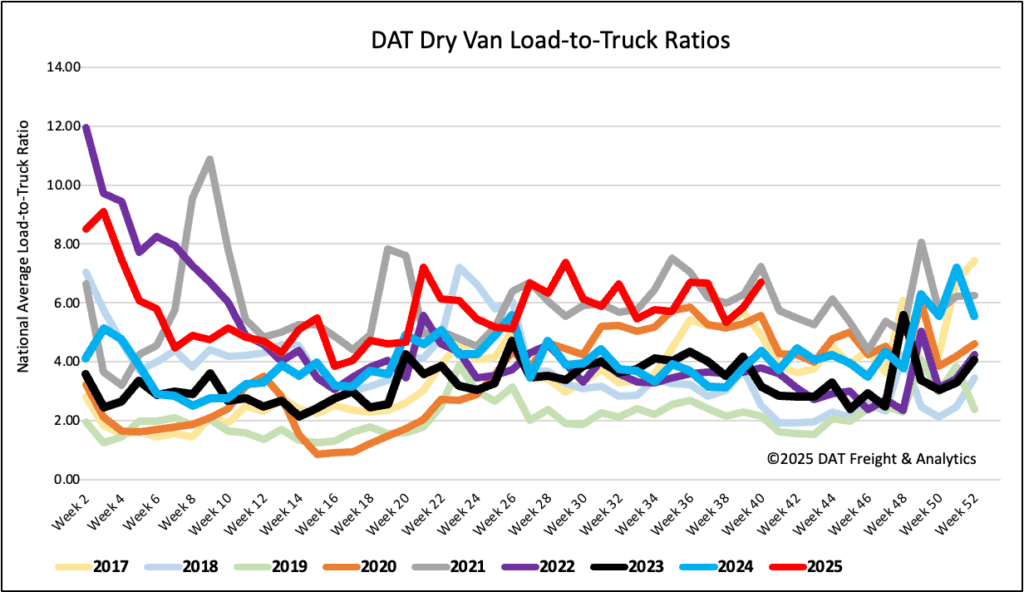
Load-to-Truck Ratio
Last week, dry van load posts rose by 4% to over one million, marking a 25% increase from last year. This surge, combined with a 12% decrease in national equipment posts, led to a slight tightening of capacity. Consequently, the dry van load-to-truck ratio settled at 6.69.
In Illinois, brokers observed very tight capacity on regional lanes, with the load-to-truck ratio averaging 4.0 and peaking at nearly 6.0 midweek. Outbound Chicago load posts climbed 15% week-over-week, pushing dry van spot rates up by $0.04 per mile to an average of $2.60 per mile for carriers. Long-haul lanes to Atlanta saw an average of $2.18 per mile last week, which is approximately $0.15 per mile higher than the previous year.
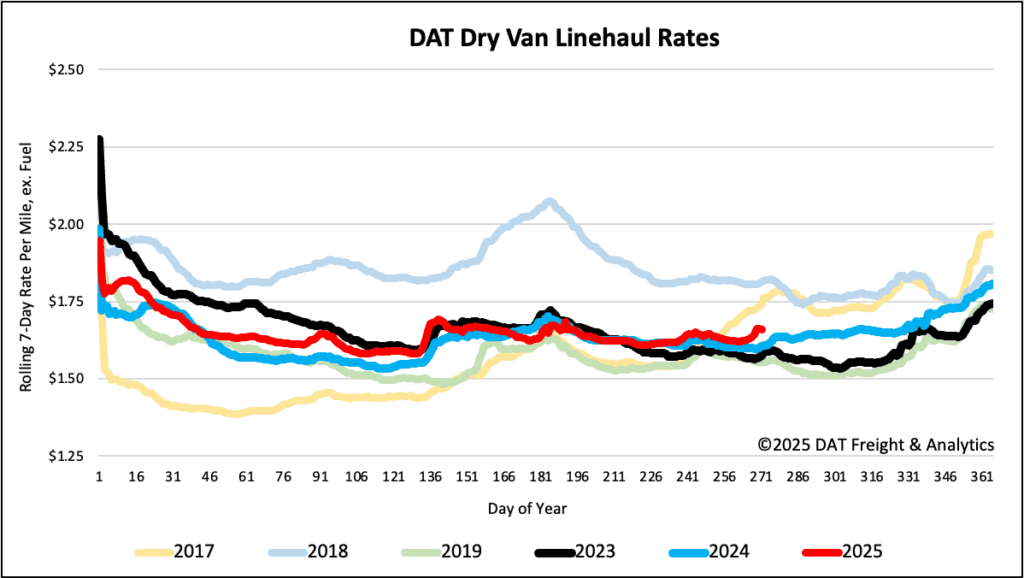
Linehaul spot rates
Dry van linehaul spot rates increased by just under $0.02 per mile last week, averaging $1.67 per mile, $0.05 higher than the same time last year.
The average rate for DAT’s top 50 lanes by load volume remained decreased by $0.01 per mile last week, averaging $1.98 per mile and $0.31 higher than the national 7-day rolling average spot rate.
In the 13 key Midwest states, which represent 46% of national load volume and often indicate future national trends, spot rates were flat. Carriers in these states earned an average of $1.87 per mile, which remained $0.20 above the national 7-day rolling average.