The latest release of the American Trucking Associations’ For-Hire Truck Tonnage Index reported a decrease of 6.3% in October after gaining 5.7% in September. “While there are indications that the economy is losing momentum, I believe October’s tonnage softness was more of a seasonal issue during a pandemic than anything else,” said ATA Chief Economist Bob Costello.
Compared with October 2019, the seasonally adjusted index contracted 8.7%, the seventh straight year-over-year decline. Year-to-date, compared with the same period in 2019, tonnage is down 3.9%.
Find loads and trucks on North America’s largest on-demand freight marketplace.
Top 10 Market Watch
Outbound load volumes increased in all of our top 10 freight markets last week, which is not surprising following the holiday break.
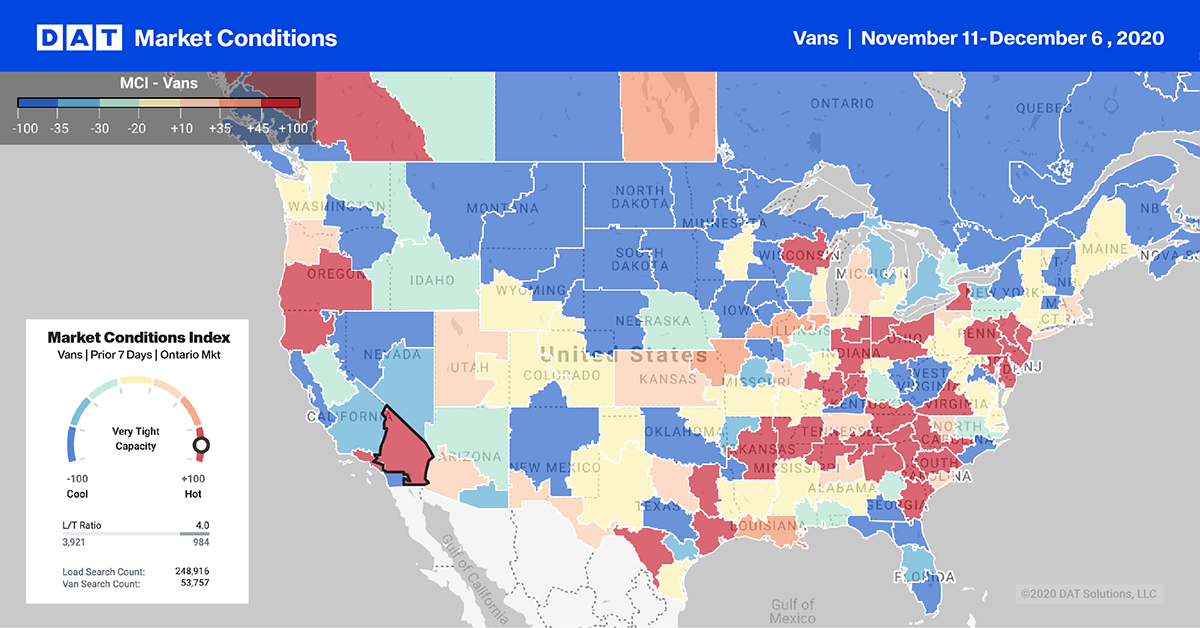
There was a surprise though, and it was the reordering of the top 10 markets with Ontario dropping to the #10 position and Los Angeles (#13) dropping out of the top 10 completely. Both markets have been in the top 3 dry van markets for most of October and November following the surge in imports on the transpacific shipping lane from Asia.
Available capacity has been very tight also driving up spot rates but last week the supply/demand balance shifted. Rates in Ontario dropped $0.13/mile to $3.17 and in nearby Los Angeles rates dropped $0.15/mile to $3.06/mile.

The dry van load-to-truck ratio (LTR) jumped to 6.01 last week and is now just slightly lower than levels last seen in 2017. The LTR increased from 3.74 to 6.01 loads in the first full shipping week after Thanksgiving, and compared to the average LTR for the eight weeks prior to the short holiday week, the dry van LTR was up 32%.
Dry van load postings spiked to 5-year record levels last week increasing by 21% compared to the weekly average for the prior two months. Carriers got back to work quickly after the holiday break with 8% fewer trucks posting for loads compared to the weekly average for all of October and November.

Even though overall national dry van contract freight volumes are down 11% y/y according to the DAT iQ’s Freight Market Intelligence Consortium, the ongoing market imbalance and resulting surge in spot market volumes didn’t have a marked impact on spot rates last week.
Available capacity tightened slightly as carriers got back to work, but with fewer loads in the contract market. The upwards rate pressure observed over the prior six months was absent last week resulting in spot rates decreasing slightly by $0.01 mile to $2.30/mile (excl. FSC). Rates are still up 43% y/y and $0.70/mile higher than the same week in 2019.