The National Retail Federation (NRF), the world’s largest retail trade association, forecasts a promising demand in the dry van sector.
“The pandemic forced parents and their school-aged children to quickly adapt to virtual learning,” says NRF President and CEO Matthew Shay. “But as we enter the new school year with plans to return to the classroom, retailers are prepared to help Americans find and purchase whatever they need to make this transition as seamless as possible.”
A recent NFR survey found families with children in elementary through high school plan to spend an average of $848.90 on school items, which is $59 more than last year. Total back-to-school spending is expected to reach a record $37.1 billion, up from $33.9 billion last year and an all-time high in the survey’s history.
College students and their families plan to spend an average of $1,200.32 on college or university items, an increase of $141 over last year. Over half ($80) of the college spend is due to increased spending on electronics and dorm furnishings. Total back-to-college spending is expected to reach a record $71 billion, up from $67.7 billion in 2020.
Confirming the NRF short-term outlook and survey findings is the recently released Retail Truck Tonnage Index produced by Yemisi Bolumole, PhD and Jason Miller at the Michigan State University.
“The implied tonnage of freight sold by retailers remained strong in June, rising an additional 4.5% from June 2020,” notes Professor Miller. “Tonnage is up an incredible 17.3% from June 2019 with two key sectors responsible for the two-year difference. Compared to 2019, these sectors are building materials — up 22% — and non-store retail, or e-commerce —up 47%. For carriers and brokers, the big question is how long will retail demand continue to prop up trucking volumes with manufacturing down 4% from the highs in 2018 and still accounting for the majority of ton-miles?”
It’s a great question and one we’ll answer on the DAT iQ Weekly Update on August 24 when Professor Miller will be our special guest.
Find loads and trucks on the largest load board network in North America.
Note: All rates exclude fuel unless otherwise noted.
Large container ships continue to surge on the transpacific trade lane connecting Asia and the West Coast, and last week’s spot rates were flat at an average of $3.16/mile to all destinations.
In the San Pedro port complex, home to the Ports of Los Angeles and Long Beach where about a third of containers arrive, 30 container ships are at anchor waiting to unload. That’s up from 11 in mid-June and the highest since March 6 as import volumes continue to climb. The queue of anchored ships raised truckload load post volumes by 7% last week.
Union Pacific Railroad’s announcement to halt all international intermodal service from the West Coast to Joliet, Illinois also raised truckload volumes. This was done as an emergency measure to get thousands of ocean containers in stacks to their cargo owners.
This is one of the heaviest traffic lanes in the intermodal sector with around 30% of intermodal volume moving between Los Angeles/Ontario and Joliet. As a result of the Union Pacific closure, truckload spot rates on this lane surged last week to reach a 12-month high of $2.90/mile. That’s $0.23/mile higher than the average recorded in June.
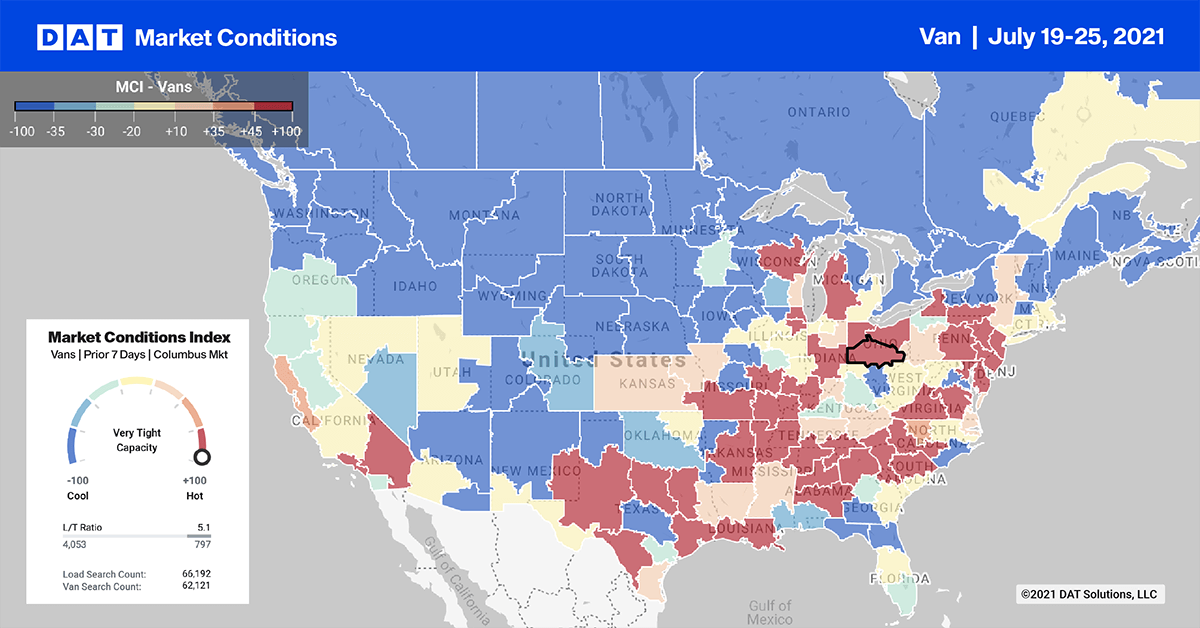
Spot rates
More seasonality was evident last week although rates appear to be sliding sideways rather than the traditional post-July 4 drop we normally see each year. Last week dry van spot rates decreased again by less than $0.01/mile to $2.41/mile. That’s three weeks in a row that spot rates have been moving sideways. Dry van rates are still $0.56/mile higher than this time last year.
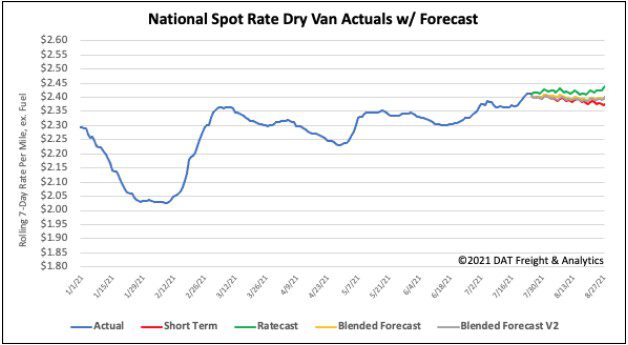
How to interpret the rate forecast:
- Ratecast: DAT’s core forecasting model
- Short Term Scenario: Formerly the pessimistic model that focuses on a more near-term historical dataset
- Blended Scenario: More heavily weighted towards the longer-term models
- Blended Scenario v2: More heavily weighted towards the shorter-term models


