By Christina Ellington
The Institute for Supply Management (ISM) Purchasing Managers Index (PMI) continues to be a reliable indicator of future demand for truckload carriers. Being a diffusion index, the PMI means any reading above 50 indicates economic expansion, so the 55.4% April reading confirms the economy has expanded for 23-months in succession. However, that’s a 1.7% decrease from a month earlier and is the lowest reading since July 2020 (53.9%). The general theme of the April report was new orders were down 0.3% m/m and inventories down 3.9% sequentially.
“Manufacturing performed well for the 23rd straight month, with demand registering slower month-over-month growth (likely due to extended lead times and decades-high material price increases) and consumption softening (due to labor force constraints). Overseas partners are experiencing COVID-19 impacts, creating a near-term headwind for the U.S. manufacturing community. Fifteen percent of panelists’ general comments expressed concern about their Asian partners’ ability to deliver reliably in the summer months, up from 5 percent in March,” according to Timothy R. Fiore, Chair of the Institute for Supply Management.
Relating this report to transportation, professor Jason Miller writes, “the key factor differentiating this period of declining spot rates from the past true freight recessions is the trajectory of durable goods industrial production. This reinforces why I keep hammering the point that we can’t interpret a decline in spot rates as an indicator that the volume of loads is declining sharply; the two need not be perfectly correlated.”
Five of the six biggest manufacturing industries — Machinery; Computer & Electronic Products; Food, Beverage & Tobacco Products; Transportation Equipment; and Chemical Products — registered moderate-to-strong growth in April. The only industry reporting a decrease in April compared to March is Petroleum & Coal Products.
The top ten manufacturing cities were collected by MNI.
According to IHS Markit PIERS, April import container volumes were up by 11% m/m and 8% y/y. Despite the ongoing port delays in China, where 425 container ships were waiting off Shanghai and Ningbo yesterday morning, higher import volumes are expected in the coming months as the backload on the transpacific trade lane starts moving again. Last Friday, contract negotiations also got underway to hammer out a new labor contract for 22,000 West Coast dockworkers. The current contract expires on July 1. According to Jim McKenna, the Pacific Maritime Association president, “The relationship between the two sides is very healthy. Working together at overcoming the [pandemic] obstacles I’ve already talked about has solidified our ability to come together.”
According to Port of Los Angeles executive director Eugene Seroka, “some shippers have diverted freight to other ports as a way to de-risk their supply chains,” and even though May and June volumes may be below last year’s volumes, Seroka said there is no sign of mass diversions ahead of the contract talks. Based on the latest import data from PIERS, April import volumes in Los Angeles (#1) and Long Beach (#3) increased by 1% and 8% m/m, respectively, while New York (#2) and Savannah (#4) increased by 5% and 32% m/m respectively. The import volume shift away from the congested West Coast continues, though. April import volumes on the East Coast were up 14% y/y while the West Coast was down 1%.
West Coast truckload capacity continues to loosen despite increasing import volumes, and on the high-volume lane between Los Angeles and Chicago, spot rates hit a new 12-month low last week. After being as high as $3.29/mile excl FSC last December, spot rates have dropped by 51% to just $1.62/mile excl. FSC and are now down by $0.79/mile y/y. Rates east to Phoenix are also down to $3.27/mile excl. FSC after being as high as $4.81/mile excl. FSC late last year. Los Angeles to Phoenix rates are also down $0.64/mile y/y.

After a slow April, dry van load post volumes are rising following last week’s 5% w/w increase making it three weeks of successive gains. Compared to the previous year, load post volumes are down 35%. Carrier equipment posts were flat last week, resulting in the dry van load-to-truck ratio increasing for the fourth week in a row from 3.78 to 4.01.

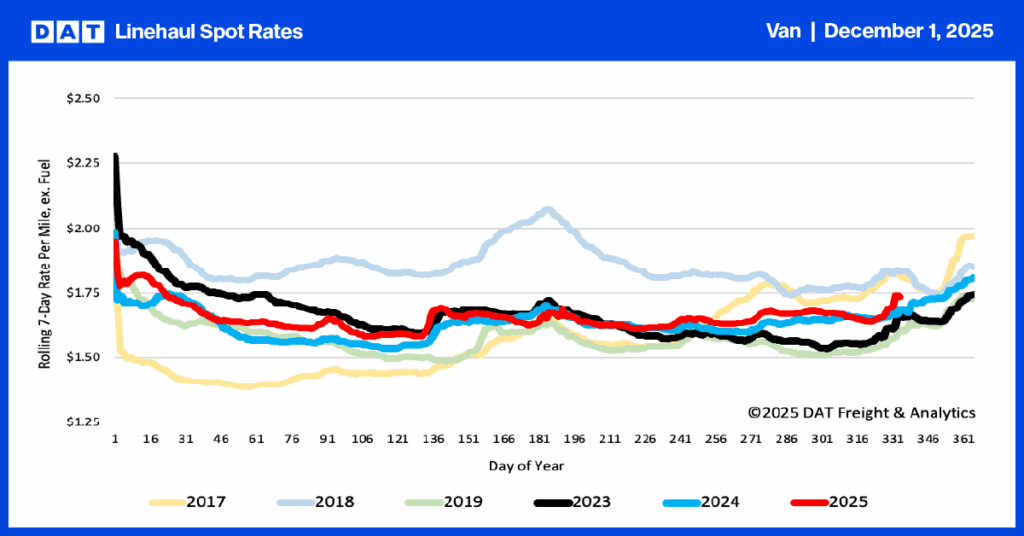
Dry van spot rates recorded the largest week-over-week decrease so far this year ending the week down just over $0.06/mile to a national average of $2.05/mile excl. FSC. Compared to the same week the previous year, dry van spot rates are now close to $0.30/mile lower after dropping $0.73/mile since the start of the year. Last week’s national average is still $0.47/mile higher the average of pre-pandemic years going back to 2016.