Truckload demand has been relatively flat to slightly up in the last 14 months based on several reliable truckload indices. That’s significant when considering some of the wild market fluctuations we’ve witnessed since the pandemic took hold of the economy.
Loads moved in DAT’s extensive freight network representing around $120 billion in annual freight spend, were flat in 2021, although contract volumes were down 14% y/y while spot volumes were up by the same amount. Representing the heavier side of the truckload freight task, the ATA For-Hire Truck Tonnage Index increased 0.6% sequentially in January, making it six consecutive months of gains (up 4.4% over that timeframe). Compared to January last year, ATA’s index is now up by 1.2% y/y for the fifth straight year-over-year gain.
According to ATA Chief Economist Bob Costello, “The index is dominated by contract freight with only small amounts of spot market truck freight, is off 3.9% from the all-time high in August 2019 and only 1.5% below March 2020 when the pandemic hit. In January, truck tonnage was helped by rising retail sales and factory output. While housing starts fell last month, which is another important driver of truck tonnage, it remained at high levels.” ATA calculates the tonnage index based on surveys from its membership and has been doing so since the 1970s.
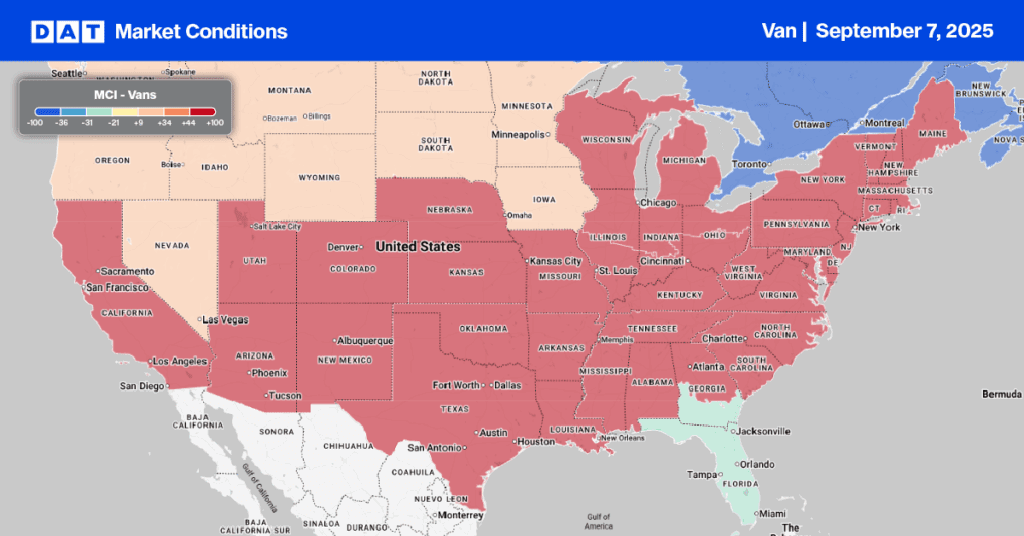
Truckload capacity tightened again last week in the Southeast, especially in the Florida panhandle region and Miami. Load post volumes in the larger Miami market jumped 13% w/w with outbound spot rates up also averaging $1.27/mile excl. FSC, an increase of $0.07/mile. There was a similar rise in outbound rates in Jacksonville, where rates averaged $2.08/mile excl. FSC while loads north to Philadelphia were down by $0.11/mile to an average of $2.28/mile excl. FSC. Further north in Charleston, SC, port congestion continues to push more volume into the truckload spot market. Load post volumes were up 13% w/w with outbound rates up by $0.02/mile to an average of $2.92/mile excl. FSC after dropping for the three weeks prior.
In Chicago, truckload capacity continues to tighten following three weeks of successive spot rate gains. Rates were up another $0.02/mile last week to an average of $3.43/mile excl. FSC while loads on the 409-mile haul west to Minneapolis increased by $0.20/mile to $3.72/mile excl. FSC last week.
Capacity tightened further south in Texas also last week where after dropping for the three weeks prior, spot rates increased by $0.06/mile to a state average spot rate of $2.34/mile excl. FSC. In the number one border-crossing market of Laredo, load post volumes were up 7% w/w, pushing up spot rates by $0.06/mile to an outbound average of $2.44/mile excl. FSC. On the number outbound volume lane from Laredo to Los Angeles, spot rates were up by $0.11/mile to $1.71/mile excl. FSC last week.
While on the West Coast, spot rates on the busiest warehouse market lane between Los Angeles and Stockton, California, rates jumped $0.47/mile to an average of $4.46/mile excl. FSC last week.
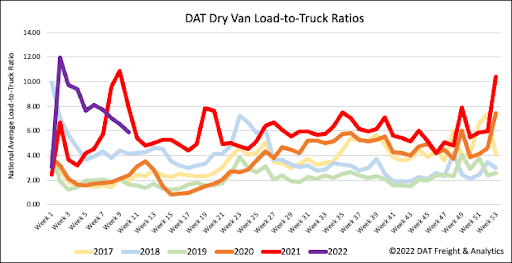
The dry van spot market continues to cool as load post volumes drop for the fourth week in a row. Last week’s volumes were 17% below this time in the previous year. Capacity continues to loosen with 4% more carrier equipment posts last week, resulting in the dry van load-to-truck (LTR) ratio decreasing by 10% to 5.88 loads per truck, which is about where it was last year as the impact of the Polar Vortex waned.
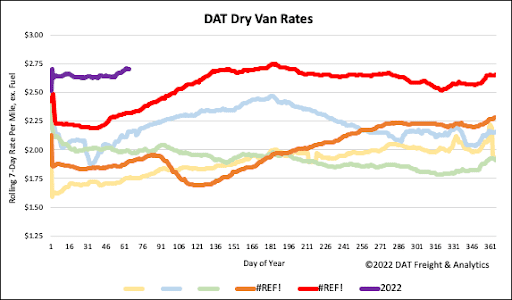
Dry van spot rates continue to exhibit signs of seasonality as they continue to decrease, albeit very slowly. Last week, the national average dry van rate remained relatively flat at $2.65/mile excl. FSC after dropping by $0.07/mile in the previous four weeks. Spot rates were still $0.39/mile higher than the last year and $0.55/mile higher than the same week in 2018.