The trucking ton-mile index revealed a continued weakening of seasonally adjusted freight demand in June, with activity declining 0.2% from May but rising 1% year-over-year. Year-over-year gains were primarily driven by sectors like wood products manufacturing, petroleum, and machinery wholesaling, which are less reliant on dry van freight. This raises questions about the relatively weak truckload pricing in the dry van space, as many growing sectors don’t align with traditional freight patterns, and possible over-estimation of manufacturing payrolls may lead to downward revisions in industrial production data.
Get the clearest, most accurate view of the truckload marketplace with data from DAT iQ.
Tune into DAT iQ Live, live on YouTube or LinkedIn, 10am ET every Tuesday.
Despite the year-over-year demand growth, it isn’t strong enough to create expansionary pricing conditions. The recent downturn suggests pre-tariff frontloading and weakening single-family home construction. According to Prof. Jason Miller, “my forecasts indicate that a bull market pricing cycle may not begin until Q2 2026, contingent on various factors, including a significant reduction in effective tariff rates.”
Load-to-Truck Ratio
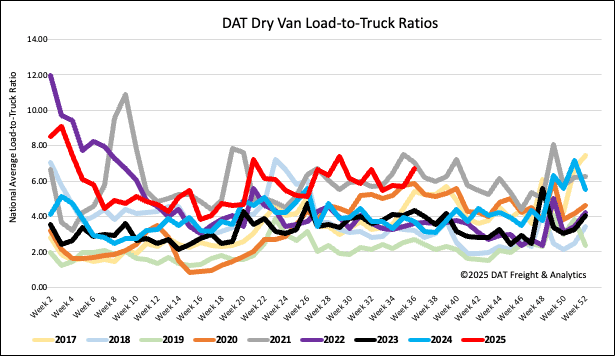
Last week, dry van load posts saw a significant increase, up 16% week over week and 32% year over year. This surge occurred in anticipation of the Labor Day long weekend and month-end. Spot market capacity experienced a slight tightening during Brake Check Week, with carrier equipment posts declining by just under 1%. Consequently, the dry van load-to-truck ratio rose by 17% to 6.69.
Linehaul spot rates
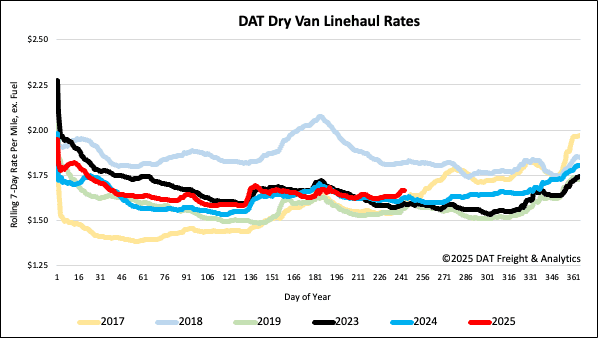
Dry van linehaul spot rates increased $0.02 per mile last week, averaging $1.67 per mile, $0.04 higher than the same time last year and $0.07 higher than in 2023.
The average rate for DAT’s top 50 lanes by load volume increased by $0.04 per mile last week to $2.03 per mile for the fourth week and $0.36 higher than the national 7-day rolling average spot rate.
In the 13 key Midwest states, which represent 46% of national load volume and often indicate future national trends, spot rates were up $0.03 on a 5% higher volume of loads moved. Carriers in these states earned an average of $1.90 per mile, which is $0.23 above the national 7-day rolling average.