The Institute for Supply Management (ISM) Purchasing Managers Index (PMI) continues to be a reliable indicator of future demand for truckload carriers – the latest March report is no exception.
Being a diffusion index, the PMI means any reading above 50 indicates economic expansion, so the 57.1% March reading confirms the economy has expanded for 22-months in succession. However, that’s a 1.5% decrease from a month earlier and is the lowest reading since September 2020 (55.4%). The general theme of the March report was new orders were down 7.9% m/m and inventories up 1.9% sequentially.
“Manufacturing performed well for the 22nd straight month, with demand registering slower month-over-month growth (likely due to extended lead times) and consumption softening slightly (due to labor force improvement),” according to Timothy R. Fiore, Chair of the Institute for Supply Management. “Omicron impacts are being felt by overseas partners, and the impact on the manufacturing community is a potential headwind. The U.S. manufacturing sector remains in a demand-driven, supply chain-constrained environment. In March, progress was made to solve the labor shortage problems at all tiers of the supply chain, which will result in improved factory throughput and supplier deliveries.”
Five of the six biggest manufacturing industries — Food, Beverage & Tobacco Products; Machinery; Transportation Equipment; Chemical Products; and Computer & Electronic Products — registered moderate-to-strong growth in March. The two industries reporting a decrease in March compared to February are Wood Products; and Petroleum & Coal Products.
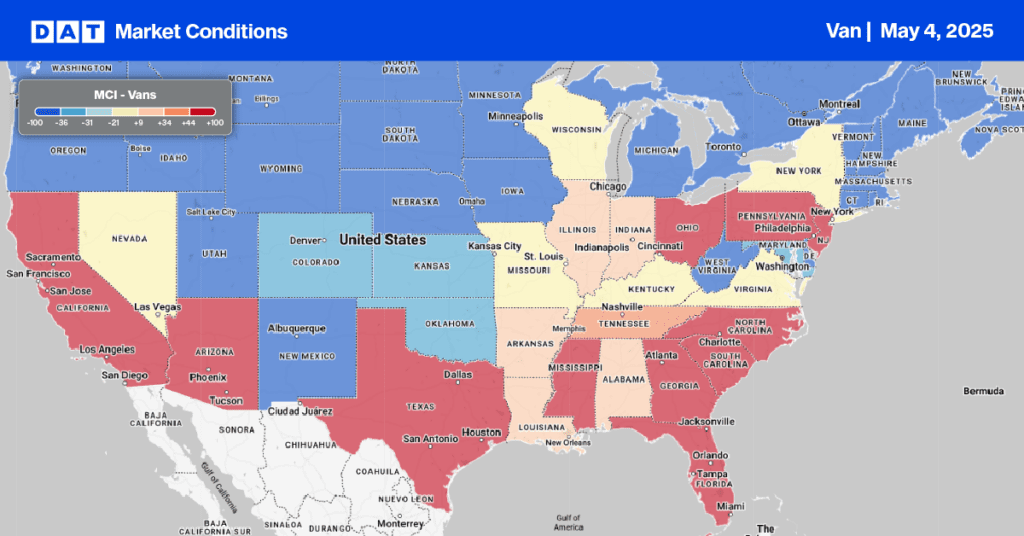
Available capacity loosens in the country’s number one port for imports from Asia. Spot rates in Los Angeles continue to slide, dropping by $0.09/mile last week to an outbound average of $2.34/mile excl. FSC. According to IHS Markit PIERS, the Ports of Los Angeles (#1) and Long Beach (#3) accounted for 34% of loaded inbound containers in March. As expected, volumes increased by just over 16% sequentially in March following the annual slowdown in February imports following the Chinese New Year celebrations. The Port of New York and New Jersey was the number two port for import volumes at 17%, recording a 22% m/m increase in March. Like on the West Coast, available capacity loosens on the East Coast, where spot rates dropped by $0.13/mile to an outbound average of $2.08/mile excl. FSC in Elizabeth, NJ.
Labor shortages in Los Angeles have led to what the Journal of Commerce describes as a “Southern California rail meltdown” as marine terminals and drayage operators point to a worsening rail backlog. A chassis shortage in BNSF’s Joliet, IL, rail terminal results in drivers waiting on average 69 minutes in March, seven minutes slower than in February. Neither situation has resulted in a noticeable shift in intermodal volumes to truckload – spot rates on the Los Angeles to Chicago have dropped almost $1.00/mile since the start of the year to an average of just $2.05/mile excl. FSC. That’s also $0.36/mile lower than last year.
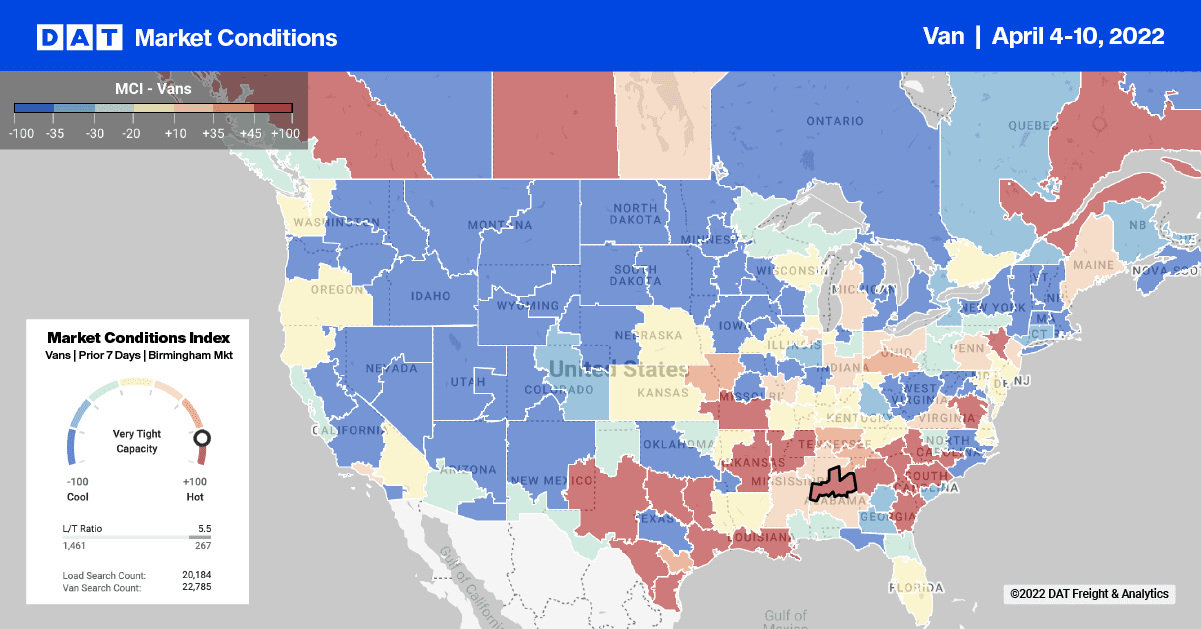
In Huntington, WV, available capacity tightens as spot rates near $5.00/mile for loads 600-miles north to Toronto. The ripple effects from the recent Canadian blockades continue to be felt in many U.S. markets, including Huntington, which ranks Canada as their largest export trading partner for plastics, machinery, and chemicals. After averaging around $2.20/mile excl. FSC for most of 2021, dry van spot rates have jumped to $4.95/mile excl. FSC this week increasing by $0.81/mile since the start of April.
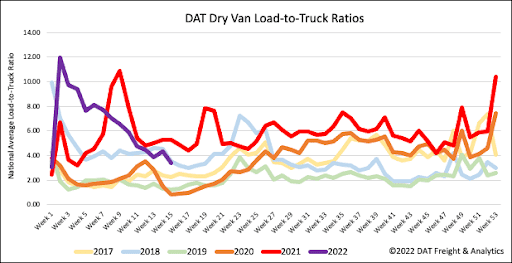
Dry van load post volumes are getting close to 2018 levels, but equipment posts are already at 2019 as last week’s load-to-truck ratio (LTR) drops again. Load post volumes decreased by 13% w/w, and equipment posts increased by almost the same amount resulting in the dry van LTR ratio dropping 20% w/w from 4.3 to 3.41. That’s now 4% below 2018 LTR levels.
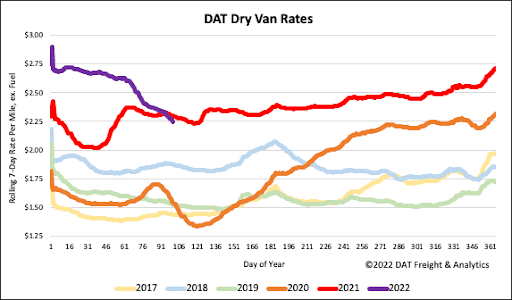
Dry van spot rates turned negative year-over-year last week and are now down 3% or $0.06/mile compared to the same week the previous year. Spot rates have dropped $0.50/mile since the start of the year ending last week at a national average of $2.28/mile excl. FSC.