The Logistics Managers Index (LMI) is a combination of eight unique components that make up the logistics industry and is calculated using a diffusion index. A greater than 50% reading indicates an expanding logistics industry while a reading less than 50% indicates a shrinking industry.
The June 2021 LMI came in at 75.0, the second-highest in the history of the index. It has now been above the 70-point mark for five consecutive months. Inventory costs and warehouse prices are driving much of this growth. Both categories recorded all-time index highs in June.
“Much of June’s increased rate of growth is driven by movements in inventory, but it’s not due to lower levels of inventory,” writes Zac Rogers, Associate Professor at Colorado State University. “Overall levels are actually up by 1.3% from the same time last year and up 4.7% from their nadir in July.”
Rogers states that the difference lies in retail sales being 48.1% higher in April compared to last April due to the reopening of the economy and ending of COVID lockdowns. Taken together with LMI inventory metrics, it suggests that a high volume of inventory is moving through supply chains at a significant velocity.
The June LMI report also notes that inventory costs are up 5.6 to 89.4. This is an all-time high and the third consecutive month when a new all-time high score has been set.
Find loads and trucks on the largest load board network in North America.
Note: All rates exclude fuel unless otherwise noted.
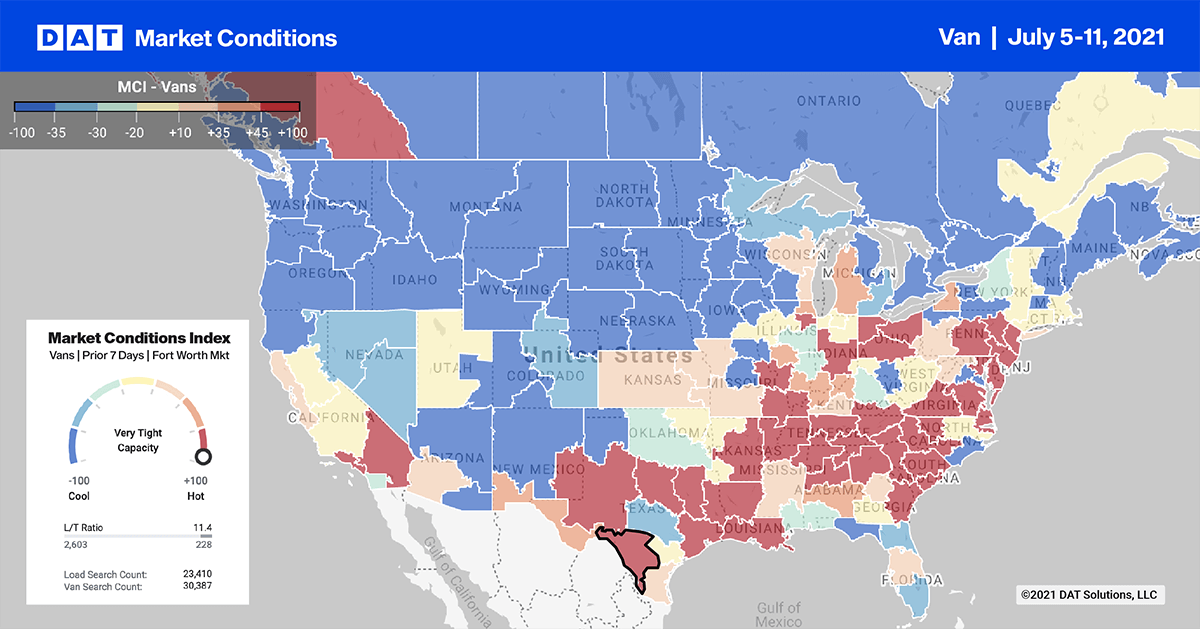
On the 400-mile run from Chicago west to Minneapolis, spot rates jumped 0.40/mile last week to an average of $3.64/mile and just over $4.00/mile for top paying loads. Further east in Buffalo, NY, spot rates reversed course last week after dropping for the last 4 months. Dry van rates were up around $0.40/mile last week to an average of $3.39/mile.
Rates north to Philadelphia from Atlanta surged last week increasing by $0.55/mile to an average rate of $4.23/mile. That’s up a whopping $1.86/mile since January and reflective of rates in the opposite direction. Those rates have dropped $0.52/mile over the same time frame.
On the West Coast on the e-commerce/import lane from Los Angeles to Phoenix, spot rates continue to climb, reaching an average of $4.76/mile last week. It’s now up $1.87/mile since February.
Spot rates
Spot rates exhibited some seasonality last week dropping in the week immediately after the July 4 long weekend — as they do every year. The short work week following Independence Day celebrations always reports lower spot market volumes. And except for 2020, spot rates usually begin the journey south.
Dry van spot rates did exactly that last week decreasing by $0.01/mile with one notable difference. This year’s spot rates are on average $0.62/mile higher than this time last year. They’re also $0.72/mile higher than the five-year post-July 4 average spot rate. That makes last week’s spot rates around 43% higher than the same period over the last five years.
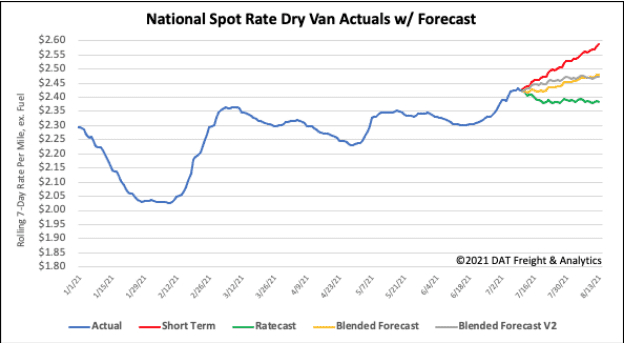
How to interpret the rate forecast:
- Ratecast: DAT’s core forecasting model
- Short Term Scenario: Formerly the pessimistic model that focuses on a more near-term historical dataset
- Blended Scenario: More heavily weighted towards the longer-term models
- Blended Scenario v2: More heavily weighted towards the shorter-term models


