In a sign of solid demand for flatbed carriers, building permits continued at a solid pace in January, increasing by 6.8% m/m but remaining 5% lower than the previous period last year. The January reading of 1.64 million housing starts (single-family and multi-family combined) decreased 4.1% m/m but represented an additional 13,000 units compared to January last year. Within this overall number, single-family starts decreased 5.6% to 1.12 million units while in the multi-family sector, which includes apartment buildings and condos, decreased 0.8% to an annualized 522,000 pace.
Most of the gains were in the West Region (26%), where January volumes grew 16% sequentially to a total of 295,000 new single-family housing starts. The largest region in the Southeast, where 56% of single-family homes were started last month – volumes (n=628,000) were down 4.7% sequentially and 2.2% y/y.
Another indicator of flatbed demand is the National Association of Home Builders (NAHB) Housing Market Index (HMI). The HMI fell by 1 point to 83 last month from a 10-month high of 84 in December and slightly below market forecasts of 84. Meanwhile, the current single-family sub-index was steady at 90. The NAHB also recently reported prices for building materials were a significant issue for 96% of builders in 2021, and 91% expect it to continue being a problem in 2022. “The high incidence of builders reporting building material problems is not surprising given recent increases in material prices,” according to the NAHB.
In San Diego and Ontario last week, flatbed capacity was very tight, pushing up spot rates by $0.17/mile to an outbound average of $2.95/mile excl. FSC. Loads from San Diego to Portland were paying $2.97/mile excl. FSC, which is almost $1.00/mile higher than the same week in 2021.
On the Gulf Coast in New Orleans, capacity was also tight – spot rates jumped by $0.52/mile to an average outbound rate of $3.35/mile excl. FSC last week. Loads from New Orleans west to Houston were up by $0.26/mile last week to an average of $2.86/mile excl. FSC. In DAT’s largest flatbed market, spot rates in Houston dropped for the third week in a row to an average of $2.75/mile excl. FSC. While the market average was down, spot rates between Houston and Ft. Worth remained elevated at $3.40/mile excl. FSC, which is $1.20/mile higher y/y.
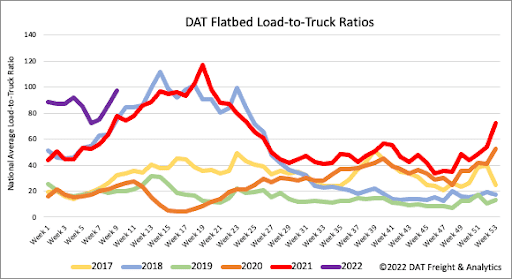
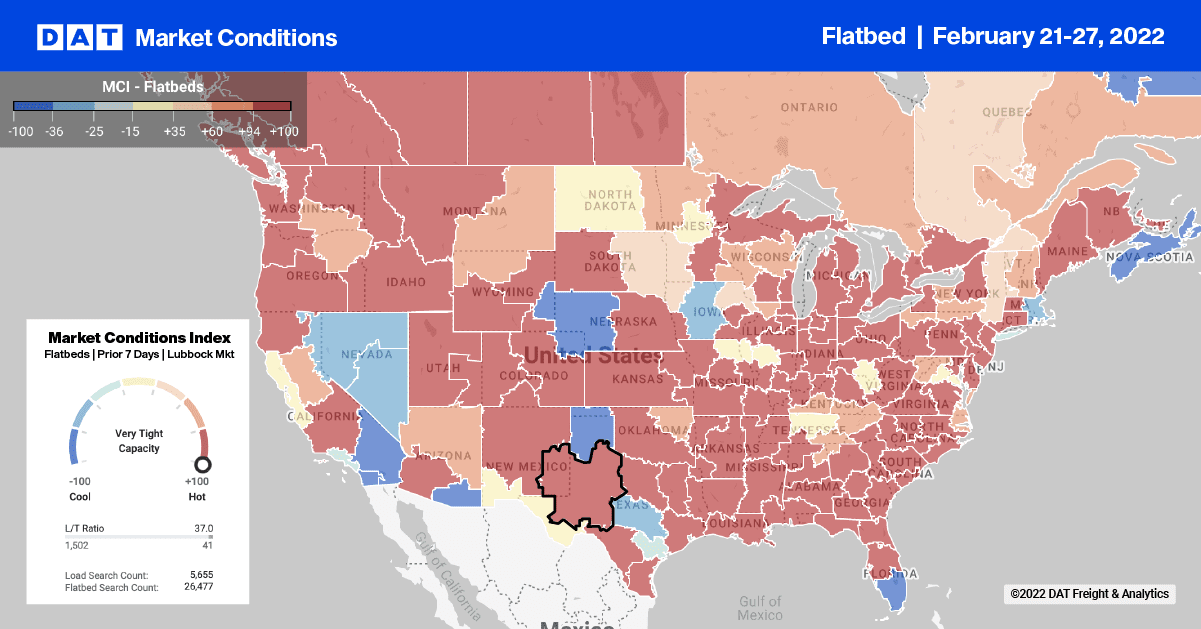
Flatbed load post volumes continue to surge following last week’s 8% w/w increase pushing weekly volumes over the 3 million mark for the first time. The flatbed market continues to track closely with 2018 and 2021 freight markets as the load-to-truck (LTR) moves closer to the 100 mark recorded in the second quarter of last year and 2018. Carrier equipment posts decreased slightly last week resulting in the previous week’s flatbed LTR increasing 14% w/w from 85.61 to 97.34.
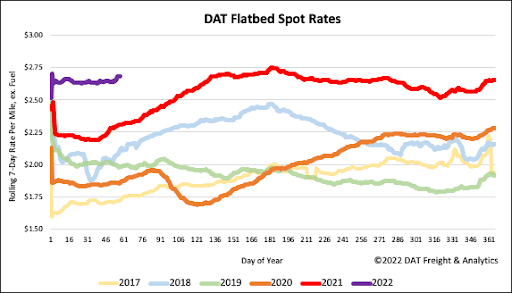
Last week’s national average flatbed spot rate of $2.68/mile excl. FSC is just $0.06/mile shy of the record $2.75/mile excl. FSC was set in June last year. Spot rates increased by just over $0.04/mile last week and are now up $0.024/mile in the previous four weeks, which is $0.37/mile higher than the previous period last year and $0.57/mile higher than the same week in 2018.