The spot market continues to offer a mixed bag. Van volumes got a late-winter boost on the West Coast, which led to higher rates on many high-traffic lanes, but it wasn’t enough to lift prices in the interior of the country.
As a result, we saw continued decline in the national average rates for vans, reefers and flatbeds. That’s a typical trend for this time of year, but volumes are starting to gather strength.
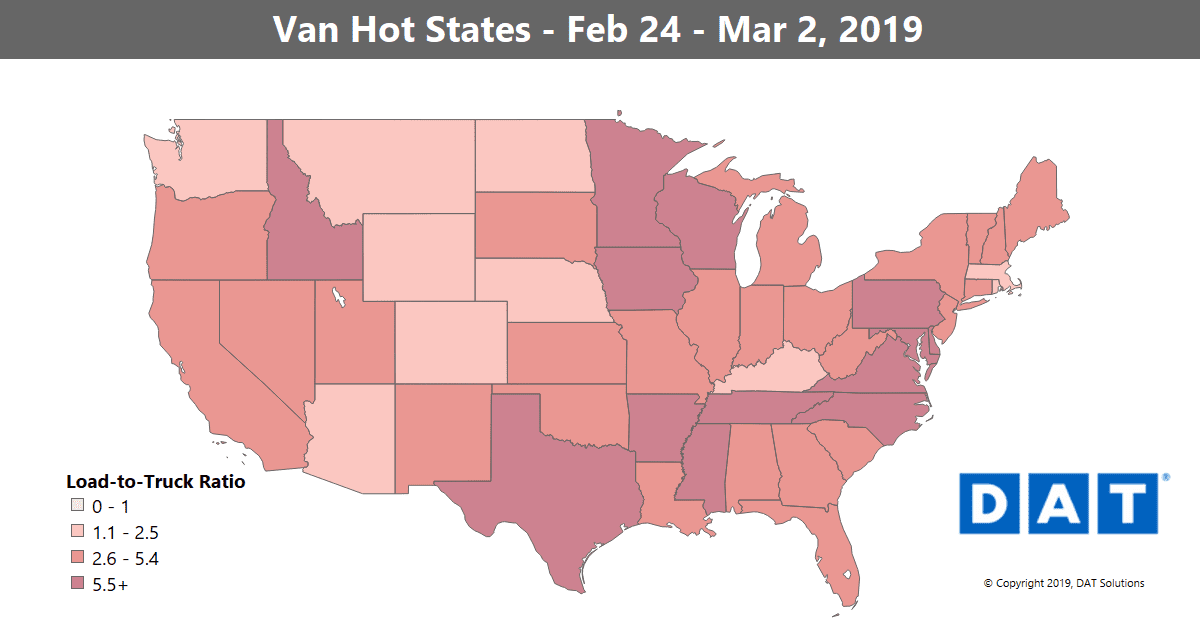
The van load-to-truck ratio increased 6% last week to 4.6 loads per truck.
VAN TRENDS
Even though the national average was down, we seem to have turned the corner in the top 100 lanes. Last week prices moved higher on 51 lanes, while 41 lanes were lower and 2 were unchanged, compared to the previous week.
Rising Rates
The West Coast is starting to see the freight that shipped from China after the Chinese New Year celebrations ended. Seattle is the closest U.S. port for those ships, and that freight was already being loaded onto trucks last week. Outbound volumes from Seattle were up by double digits. Volumes were also up from other markets with seaports, including Stockton and Los Angeles – which is home to the two biggest ports in North America. Those increases in truck freight were small compared to Seattle’s, which tells us that we could see a surge of van freight out of California this week and next. Specific lanes that are tied to the seaport activity:
- The lane from Seattle to Los Angeles increased 14¢ to $1.35/mi.
- Seattle to Salt Lake City gained 13¢ to $1.84/mi.
- Seattle to Spokane also added 13¢, moving up to $3.38/mi.
- Also on the West Coast, Stockton to Salt Lake City moved up 17¢ to $2.52/mi.
- Back East (and not a seaport) Buffalo to Charlotte bumped up 10¢ to $2.25/mi.
Falling Rates
Over the past month we’ve seen rates fall from Chicago, Columbus and Dallas. Lanes that showed declines last week included:
- Chicago to Allentown dropped 12¢ to $2.57/mi.
- Dallas to Denver fell 10¢ to $2.03/mi.
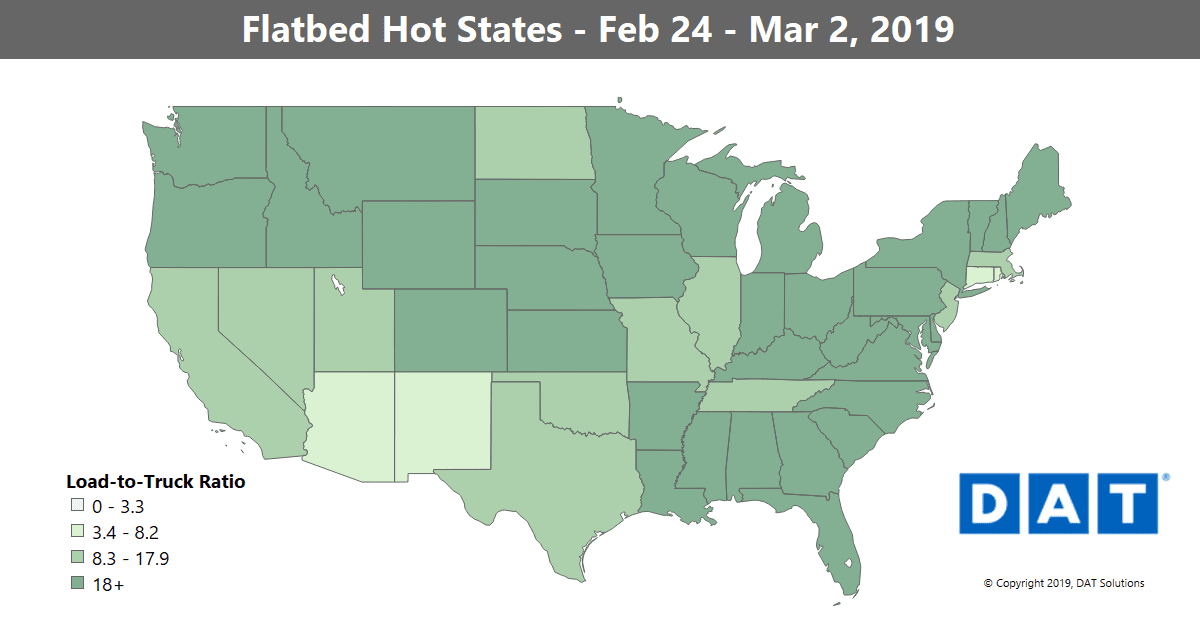
The flatbed load-to-truck ratio increased 2% last week to 25.7 loads per truck.
FLATBED TRENDS
Flatbed rates have drifted down in the last month, despite strong February volumes. Year-over-year, flatbed volumes are up 15-20% in February compared to 2018. But this year there’s more capacity, both from additional trucks on the road and more efficient use of current equipment.
Rising Rates
Flatbed markets have been up and down for the past month or more. Last week saw strong movements out of Baltimore, Fort Worth, Cleveland and Savannah. Lanes with big price increases included:
- Reno to Los Angeles jumped 80¢ to $2.73/mi.
- Roanoke to Cleveland gained 54¢ to $2.67/mi.
- Cleveland to Milwaukee increased 50¢ to $4.38/mi.
Falling Rates
Oil-related freight movements from Houston are definitely in a lull. Texas has been experiencing freezing temperatures of late, even in South Texas, leading to lower rates. Also, farming machinery has not yet started to move in volume, leading to lower rates out of Rock Island, IL:
- The lane from Rock Island to Kansas City fell 64¢ to $2.33/mi.
- Rock Island to Indianapolis dropped 53¢ $2.91/mi.
- Further south, Memphis to St. Louis dove 79¢ to $3.01/mi. – perhaps just winter lingering
Find loads, trucks and lane-by-lane rate information in DAT load boards, including rates from DAT RateView.


