The May 2021 report of the Logistics Managers Index (LMI) produced by Colorado State University (CSU) states a decrease of 3.2 points to 71.3. This marks the seventh of the last nine months when the index reached the 70’s. These months have all been well above the all-time average of 63.3.
“The tightness that has been observed in the logistics industry over the last 10 months continued unabated in May 2021 with the latest reading indicating a significant rate of growth,” says Zac Rogers, Assistant Professor at CSU. “The strains of this continued rate of growth are being felt most acutely on price metrics, which continue to grow at a meteoric pace.”
The LMI survey respondents from the Council of Supply Chain Management Professionals (CSCMP) reported the hard shift in economic activity is akin to going from standing still to a full sprint. As expected, it has put tremendous pressure on supply chains.
Many supply networks are currently suffering from the phenomenon known as the “bullwhip effect.” Smaller variations in demand at the consumer level leads to wild swings further up the chain. The effects of this are apparent in the ongoing lack of warehouse capacity reported by respondents in May, as inventory rushes in and retailers struggle to keep products on shelves.
For carriers this is translating into much higher dwell times for trailers. They sit at shipper locations waiting to be unloaded and are effectively unavailable for dispatch.
Find loads and trucks on the largest load board network in North America.
Note: All rates exclude fuel unless otherwise noted.
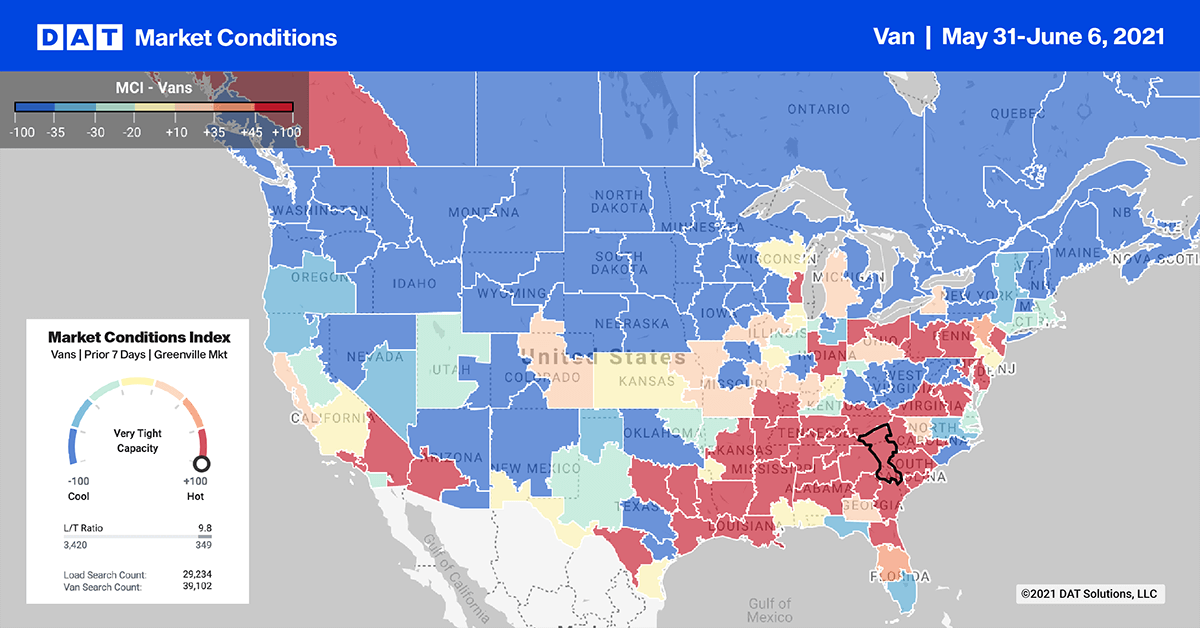
The shorter work week following the Memorial Day weekend resulted in 14% lower dry van volumes in the Top 10 markets. However, there was very little change in the average spot rate. Spot rates stayed at $2.62/mile last week.
Capacity continues to tighten on the West Coast where record level container volumes continue to flood in from Asia. In Los Angeles, volumes were down 17% while rates increased $0.01/mile to an average of $3.07/mile to all destinations. In nearby Ontario, rates increased $0.03/mile to $3.21/mile on decreased volumes.
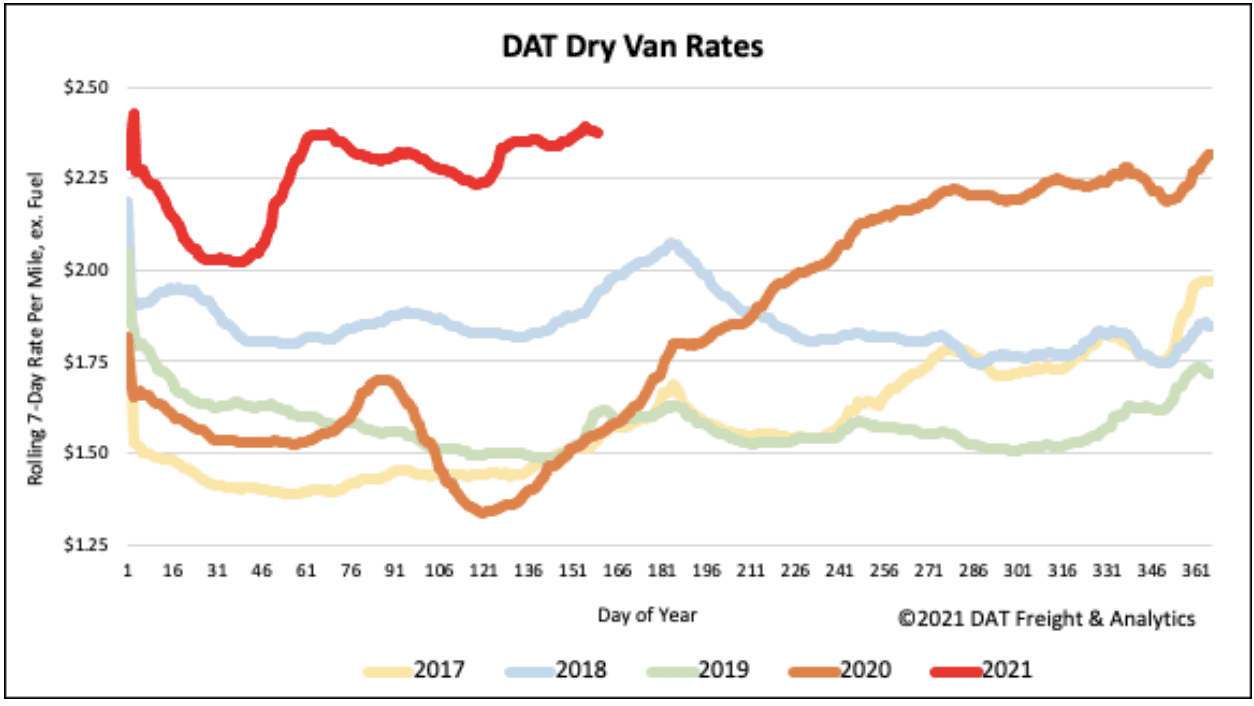
Spot rates
Even though spot market volumes dropped again last week, available capacity continues to tighten with spot rates moving up another $0.04/mile to $2.39/mile over the course of the short work week. Dry van spot rates are still $0.83/mile higher than this time last year and $0.43/mile higher than the same week in 2018.
How to interpret the rate forecast:
- Ratecast: DAT’s core forecasting model
- Short Term Scenario: Formerly the pessimistic model that focuses on a more near-term historical dataset
- Blended Scenario: More heavily weighted towards the longer-term models
- Blended Scenario v2: More heavily weighted towards the shorter-term models


