April’s imported container volumes were down close to 5%. However, it is typically the second slowest month on the shipping calendar after March, so there’s no cause for concern with the April numbers. However, we’re also seeing shippers struggling to restock inventory in preparation for the 2021 fourth-quarter holiday shopping season, which typically peaks in September.
Load board volumes and spot rates in port markets track closely with loaded import container volumes, so we can expect this to continue based on current ocean freight trends.
“Sixty percent of all deep-sea vessels globally were more than a day late in arrival during March,” says Lars Jensen, container shipping expert. “Despite the poor state of affairs, this actually is an improvement compared to January and February. In itself this is still very problematic for anyone wishing to have a timely supply chain. But at least this is the first time since mid-2020 we have seen a material improvement in reliability statistics rather than a decline.”
Find loads and trucks on the largest load board network in North America.
Note: All rates exclude fuel unless otherwise noted.
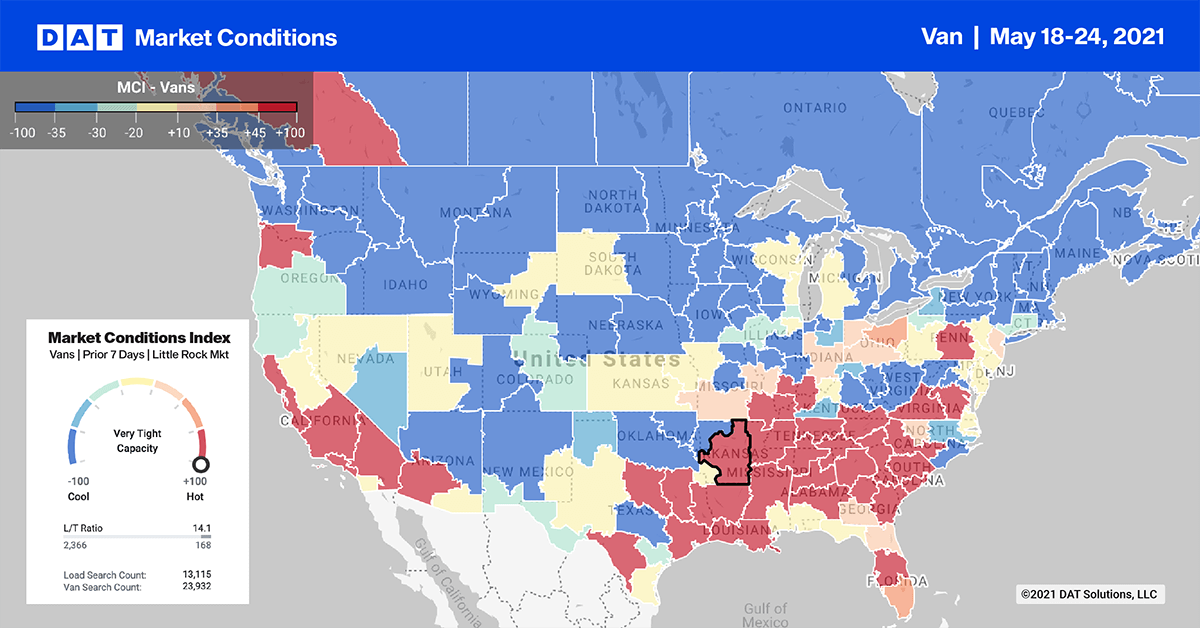
Load posts in the Top 10 markets dropped by 8% last week, although capacity remained flat with no change in the average outbound spot rate at $2.60/mile.
Memphis was only market to report higher volume with a 3% increase. But as expected, capacity tightened following the extensive delays created by the I-40 bridge closure.
All other Top 10 markets reported volume decreases last week. Los Angeles’ and Ontario’s volumes dropped by 8%. Both of their capacities tightened with spot rates increasing $0.01/mile. Los Angeles’ rates increased to $3.03/mile while Ontarios’ rates increased to $3.12/mile.
In Atlanta, volumes were down 11% but overall market capacity was tight, pushing rates by $0.03/mile to all destinations. On the Atlanta-Philadelphia lane, rates rose to $3.28/mile last week after being around $2.91/mile since last July.
Spot rates
Dry van spot rates decreased for the second week in a row following last week’s $0.02/mile decrease to $2.40/mile. For context, spot rates are still $0.93/mile higher than this time last year and $0.55/mile higher than the same week in 2018.
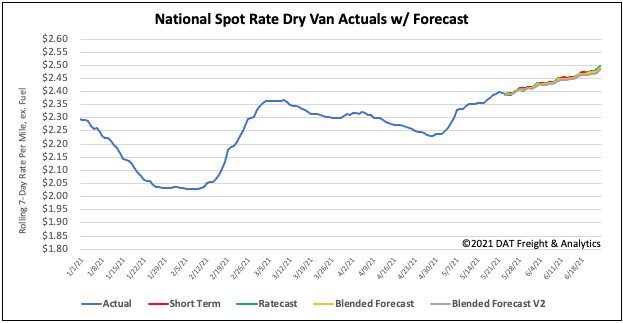
How to interpret the rate forecast:
- Ratecast: DAT’s core forecasting model
- Short Term Scenario: Formerly the pessimistic model that focuses on a more near-term historical dataset
- Blended Scenario: More heavily weighted towards the longer-term models
- Blended Scenario v2: More heavily weighted towards the shorter-term models
> Learn more about rate forecasts from DAT iQ