As Florida prepares for Hurricane Dorian’s expected landfall during the Labor Day weekend, data scientists at DAT took a look at how transportation markets have reacted.
Dorian was classified as a hurricane on Aug. 29, with its anticipated course set to hit Florida’s Atlantic Coast. Upgrading the storm to a hurricane had a significant impact on demand and rates for inbound freight to Central Florida.
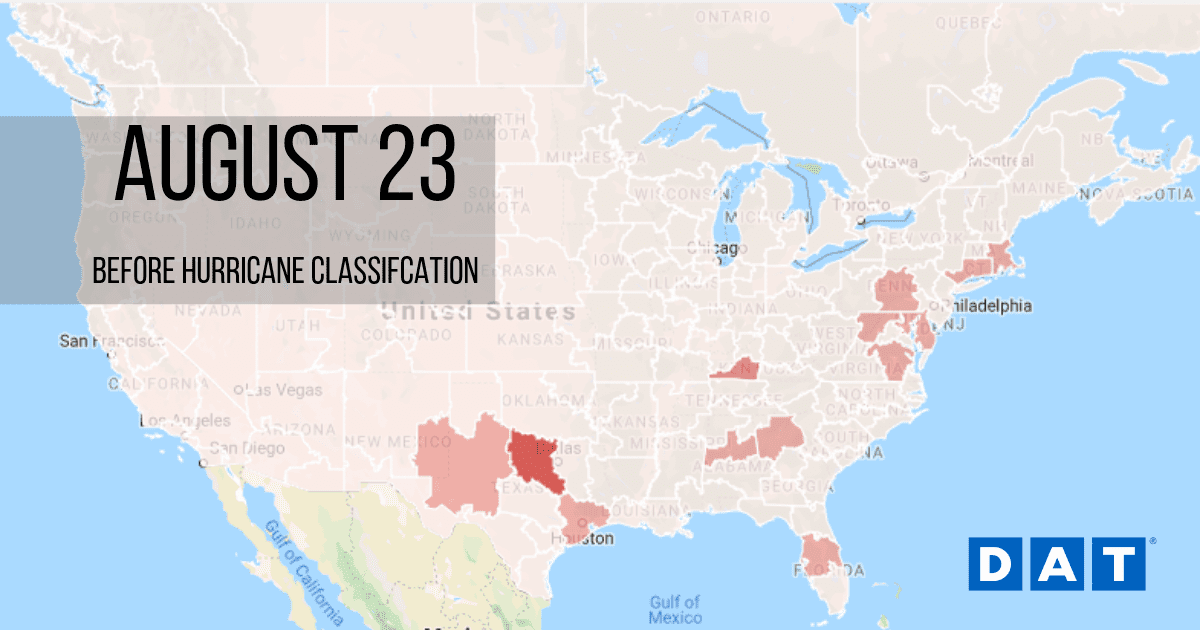
The map below shows market conditions in the week before the storm grew to hurricane strength, with the dark red areas showing higher demand for inbound trucks.
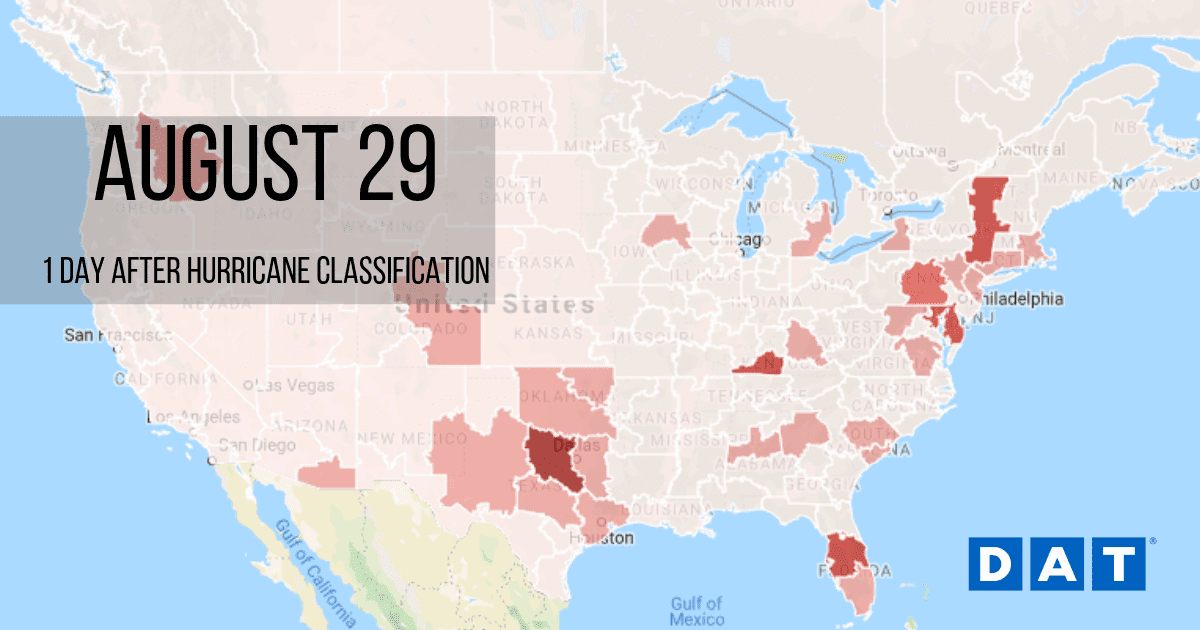
Below is the same map, one day after Dorian was upgraded to a hurricane.
The data science team also looked at how news of the storm affected their predictive rates model.

The above graph shows van rates on the lane from Atlanta to Lakeland, FL, with rates forecasted into the future by our Data Analytics team’s predicitive rates model. As you can see, the model reacted to news of the hurricane by greatly increasing its predictions.